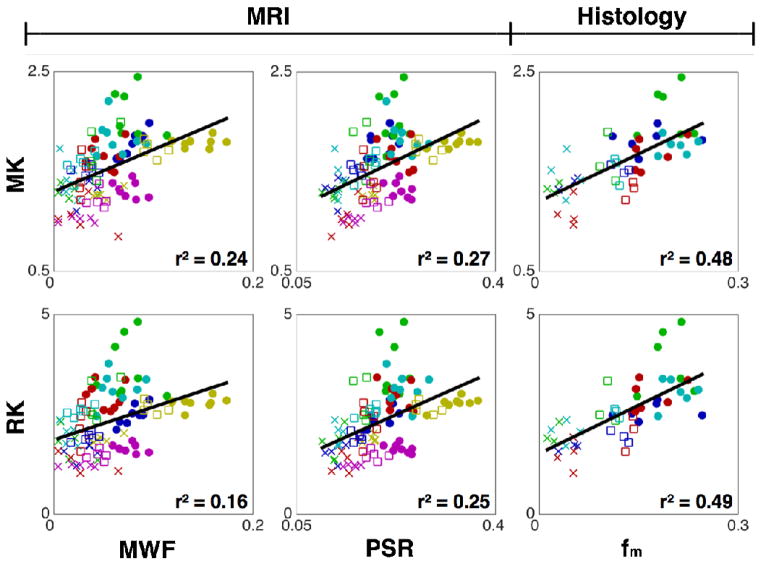
FIG. 11.
Linear correlation plots between DKI metrics MK and RK (y-axis) and myelin measures MWF, PSR, and fm (x-axis). Each point is an ROI mean from an individual mouse brain. The shape represents the group: control = circle, Rictor = square, and TSC = x and the color represents the WM region: MidCC = blue, GCC = green, SCC = red, AC = cyan, EC = magenta, IC = yellow. For significant correlations, r2 is shown in the lower right-hand corner of each plot. MK, RK, MWF, PSR, and fm are unitless.

