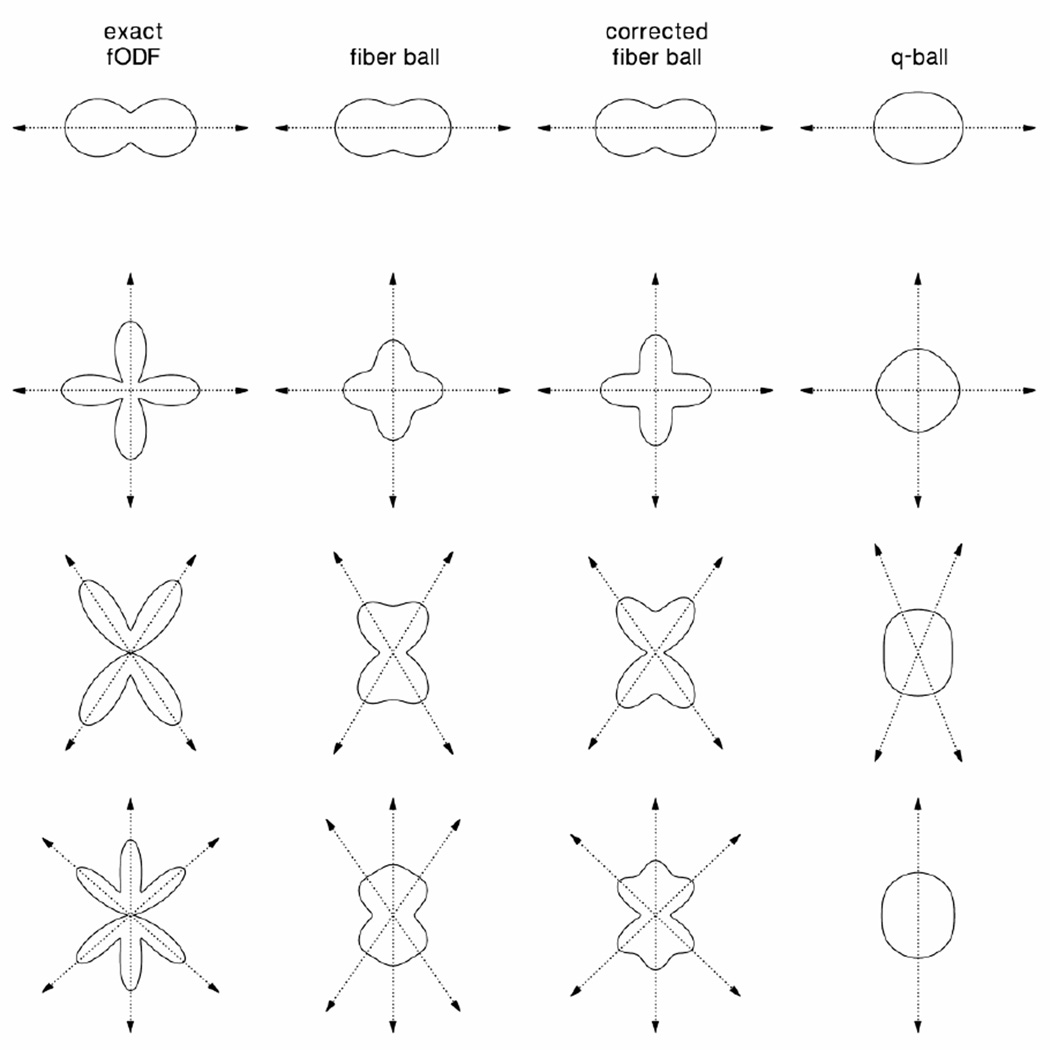
Figure 2.
Numerical simulations of exact fODFs, for four different examples, together with the corresponding fiber ball, corrected fiber ball, and q-ball approximations, all shown with solid curves. The dotted arrows indicate the directions of the peaks (local maxima) for each of the angular profiles. The fiber balls and q-balls all give smoothed approximations of the fODFs. The fiber balls were obtained from the inverse Funk transform of the dMRI signal, which was calculated from the exact fODF by using Eq. (17) with bDa = 5. The q-ball was found by applying a Funk transform to the same signal and is necessarily smoother than the fiber ball because of the intrinsic properties of the Funk transform. The corrected fiber ball was derived by using Eq. (23) with bD0 = 12 to partially compensate for the smoothing effects of a finite b-value. For the last example (bottom row), the q-ball only detects one of the three peak directions.

