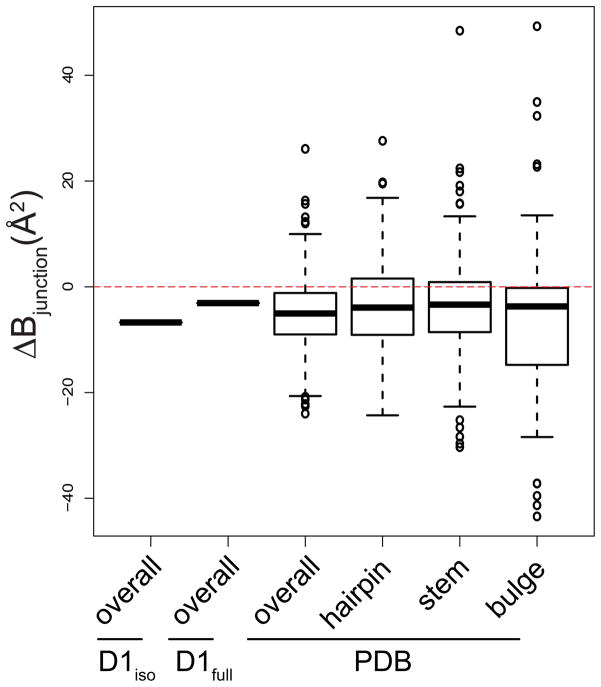
Figure 3.
Box plot showing difference average B-factors between the junction residues (denoted as ΔBjunction, on y-axis) and specific motifs taken from D1iso, D1full and from all RNA entries in PDB (x-axis). “Overall” means ΔBjunction is the difference between junction residues and all residues in a specific structure. “Stem”, “hairpin” and “bulge” means the ΔBjunction is the difference between junction residues and stem, hairpin and bulge residues in a specific structure. The red dashed line indicates zero ΔBjunction value. For the D1iso and D1full group, the thick band indicates a single value. For groups from “PDB”, the thick band indicates the median, the box indicates the upper and lower quantiles, the vertical line indicates the variability, and the individual dots represent outliers.

