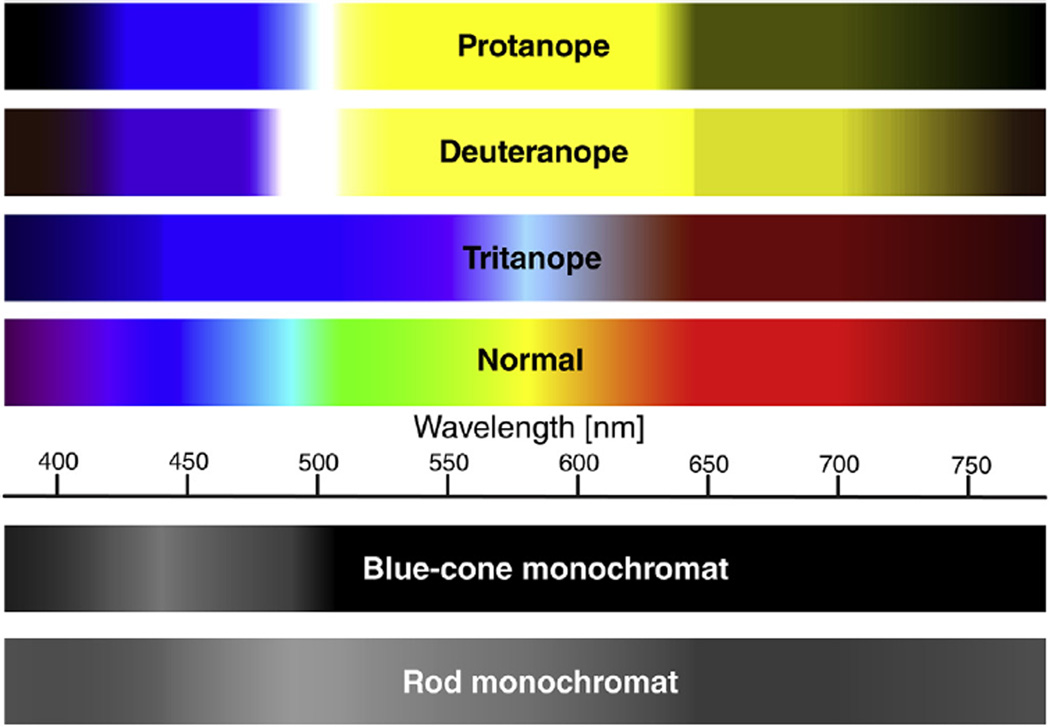
Fig. 5.
Comparison of normal and deficient color vision. Visible spectra illustrated for five types of human color blindness are adapted from (Karl and Gegenfurtner, 2001). The spectra represent only severe cases of color vision deficiencies and a common spectrum for normal color vision. Actually, there are milder degrees of color vision deficiencies such as deuteranomaly and protanomaly. These anomalous trichromats contain at least one normal cone opsin and one set, which evidence a minor spectral shift from each other (Bollinger et al., 2004; Yamaguchi et al., 1997). Furthermore, 38% of Caucasian males with normal trichromacy contain variation in the red opsin that alters the normal spectrum.

