Figure 1.
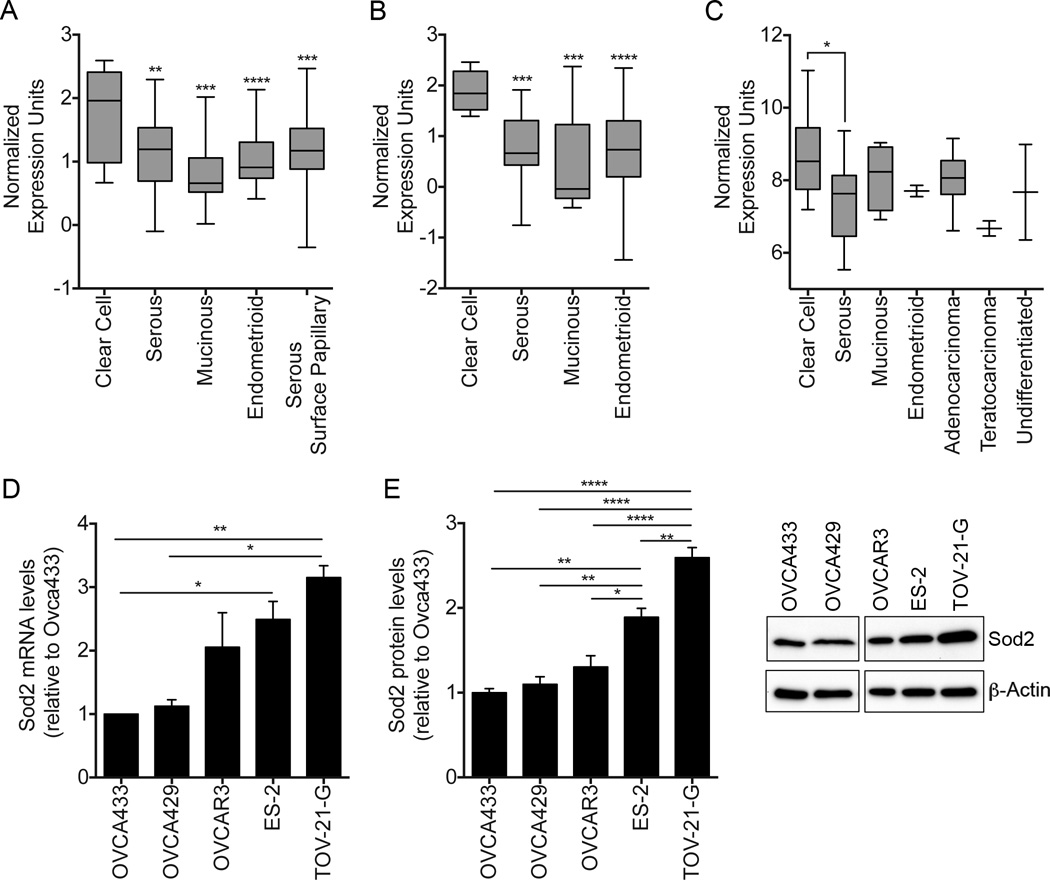
Increased Sod2 mRNA expression is observed in ovarian clear cell carcinomas (OCCC) compared to other ovarian carcinoma histological subtypes. Two representative data sets from ovarian cancer micro-array studies are displayed as box and whisker plots (data obtained through oncomine.org). A. Clear cell (n=16), Serous (n=24), Mucinous (n=8), Endometrioid (n=29), Serous Surface Papillary (n=107); One-way ANOVA (p<0.0002), Tukey’s post-test **** p<0.0001, ***p<0.001, **p<0.01 (GSE2109). B. Clear cell (n=8), Serous (n=41), Mucinous (n=13), Endometrioid (n=37),; One-way ANOVA (p<0.0001), Tukey’s post-test ***p<0.001 (GSE6008). C, Sod2 mRNA expression was significantly increased in a panel of OCCC lines, listed in Methods section, compared to serous adenocarcinoma cell lines (Affymetrix array; ANOVA Tukey’s post-test *p<0.05)
D, Semi-quantitative real-time RT-PCR was performed to assess Sod2 mRNA expression in serous ovarian cancer cell lines OVCA433, OVCA429 and OVCAR3 and OCCC cell lines ES-2 and TOV-21-G (data expressed relative to OVCA433, which displayed lowest Sod2 expression). E, Immunoblot analysis and densitometric quantification of Sod2 protein expression in ovarian cancer cell lines (For D & E: Mean ± SEM, n=3, ANOVA, Tukey’s post-test **** p<0.0001, ***p<0.001, **p<0.01, * p<0.05).

