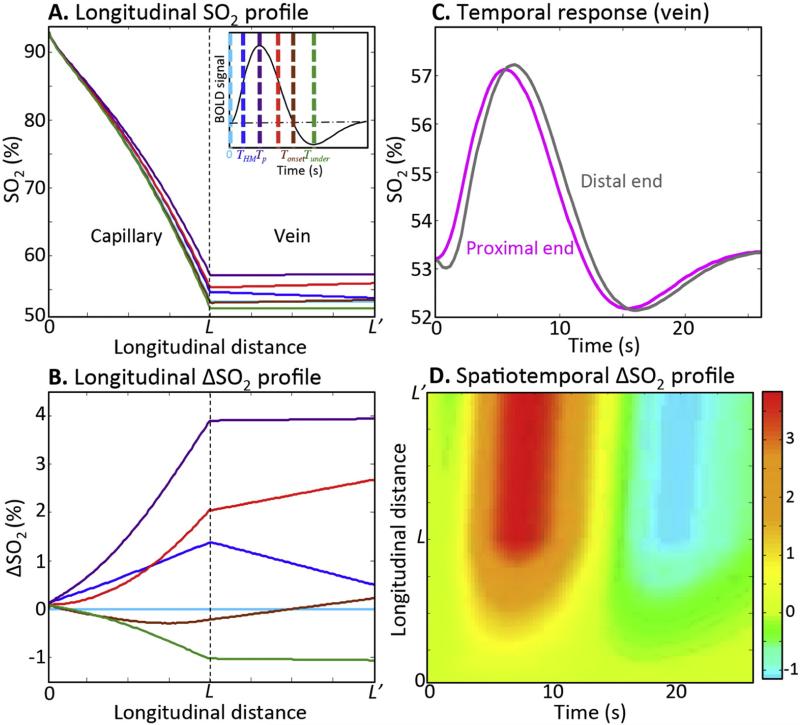
Fig. 4.
Characteristics of the arterial impulse model. Examples of longitudinal (A) SO2 and (B) ΔSO2, profiles for six time points in capillary and vein: resting (light blue), initial half-maximum (blue), HRF peak (purple), trailing half-maximum (red), undershoot-onset (brown), undershoot peak (green). Inset shows these time points on a stereotypical HRF. (C) Examples of SO2 time course for distal (gray) and proximal (magenta) ends of the vein. (D) An example of spatiotemporal color contour map for ΔSO2 in capillary and vein.

