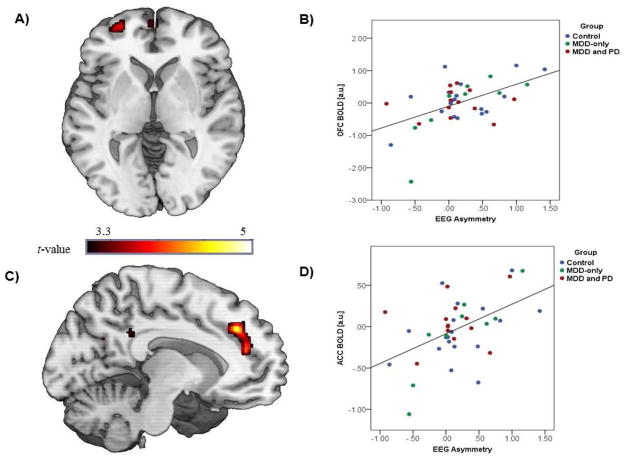
Figure 2. Correlation between EEG and fMRI reward anticipation measures.
A) Voxel-wise statistical t-map displayed on a canonical brain illustrating significant convergence between EEG asymmetry and left OFC BOLD response during reward anticipation; B) Scatter plot displaying the correlation between EEG asymmetry and OFC BOLD response; C) Voxel-wise statistical t-map displayed on a canonical brain illustrating significant convergence between EEG asymmetry and left ACC/medial PFC BOLD response during reward anticipation; D) Scatter plot displaying correlation between EEG asymmetry and ACC/medial PFC BOLD response; OFC = orbitofrontal cortex; ACC = anterior cingulate cortex; EEG = electroencephalogram; MDD = major depressive disorder; PD = panic disorder. Of note, estimates of ACC/mPFC and OFC activation were normally distributed across the sample (ACC/mPFC: M= −0.02±0.37, range: −1.06 – 0.68, skew: −0.37, kurtosis: 0.81; OFC: M= 0.02±0.66, range: −2.43 – 1.16, skew: −0.37, kurtosis: 2.01).

