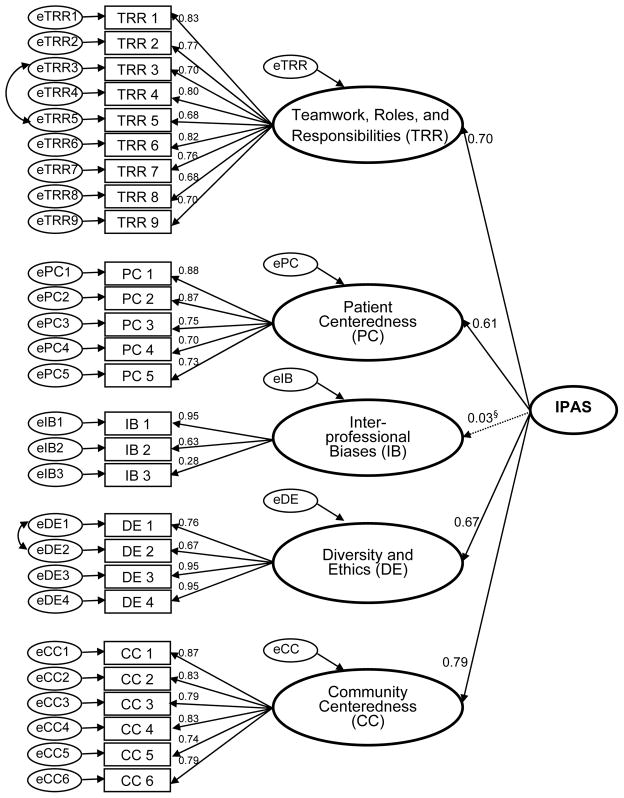
Figure 2.
Confirmatory Factor Analysis Model. The values presented above the arrows going from the Interprofessional Attitudes Scale (IPAS) to its subscales are path coefficients; they represent the ‘relationship’ between the IPAS and its subscales. Two sets of items, TRR3 and TRR5 and DE1 and DE2, were significantly correlated; these correlations are represented as curved arrows. §The path coefficient for the Interprofessional Biases subscale is low (0.03; p=0.61) indicating this subscale did not load significantly on the IPAS. See text for discussion.

