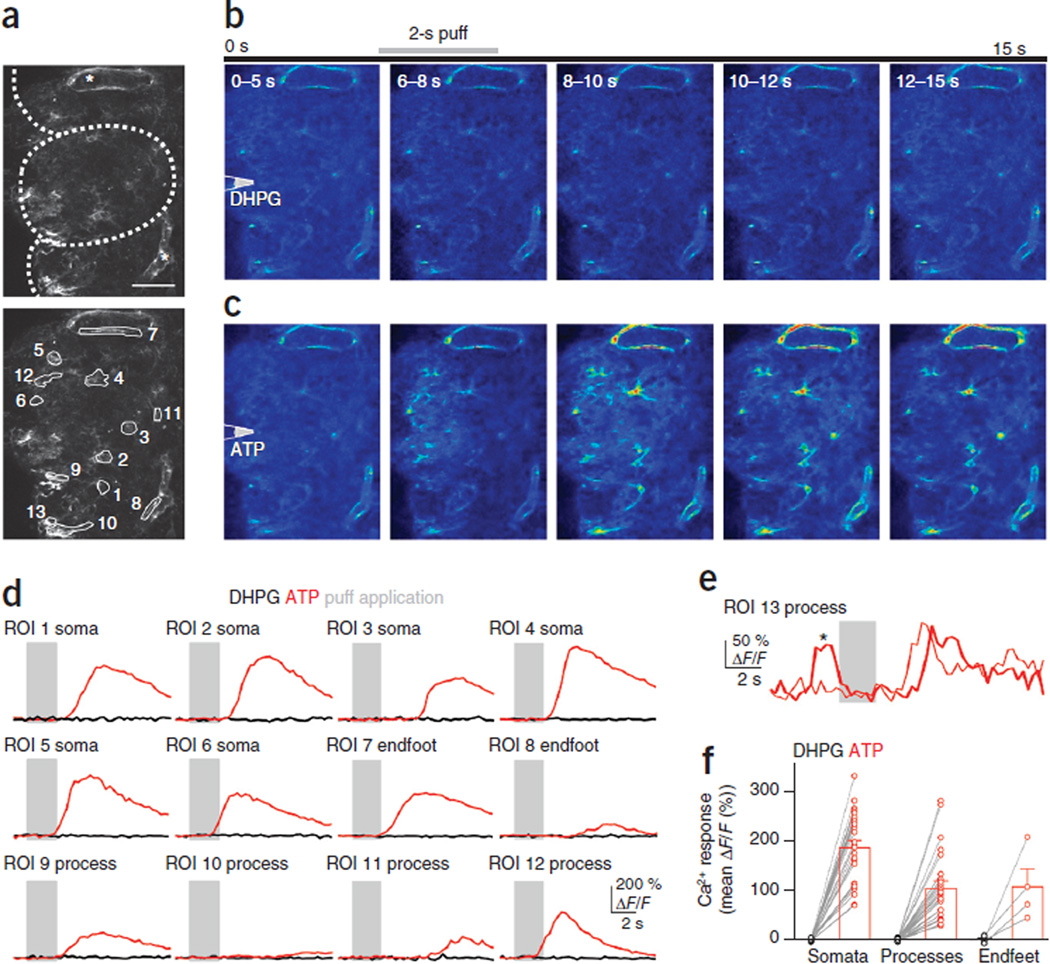
Figure 6.
Effects of ATP and mGluR5 agonists on glomerular astrocytes from adult Cx30-CreERT2; R26-lsl-GCaMP3 mice. (a) Top, a number of astrocytes are labeled, including endfeet processes (asterisks) outlining blood vessels. Dotted lines indicate glomerular boundaries. Bottom, ROIs covering astrocyte somata (1–6), endfeet (7 and 8) and processes (9–12). Images are maximum projections from around the imaging plane (i.e., the surface at 20 µm above to 10 µm below). Scale bar, 50 µm. (b) Averages of movie stills (taken at 3.3 Hz) taken during the indicated time intervals. Puff is triggered at 5 s for 2 s (gray bar) from pipette positioned above slice surface. Puffs of 100 µM DHPG (in the presence of 100 µM CPCCOEt) failed to elicit Ca2+ increases in astrocytes. (c) In the same glomerulus, subsequent puff application of 500 µM ATP elicits robust Ca2+ increases, indicating that astrocytes are viable. (d) Responses from ROIs shown in a to DHPG (black) and ATP (red). Gray bars indicate puff application. Responses are averages from 3–5 trials (trials with spontaneous activity were omitted from the average). (e) Example of two successive trials recorded from the astrocyte process in ROI 13. In one (thick trace), a rapid spontaneous event (asterisk) precedes the stimulus. Consequently, this ROI was not used for further analysis. (f) Average responses from all identified astrocyte somata, processes and endfeet to DHPG (black) and ATP (red) application (n = 27 somata, 26 processes, and 4 endfeet from 4 mice). Lines connect data from individual ROIs (circles). Data are presented as mean ± s.e.m.

