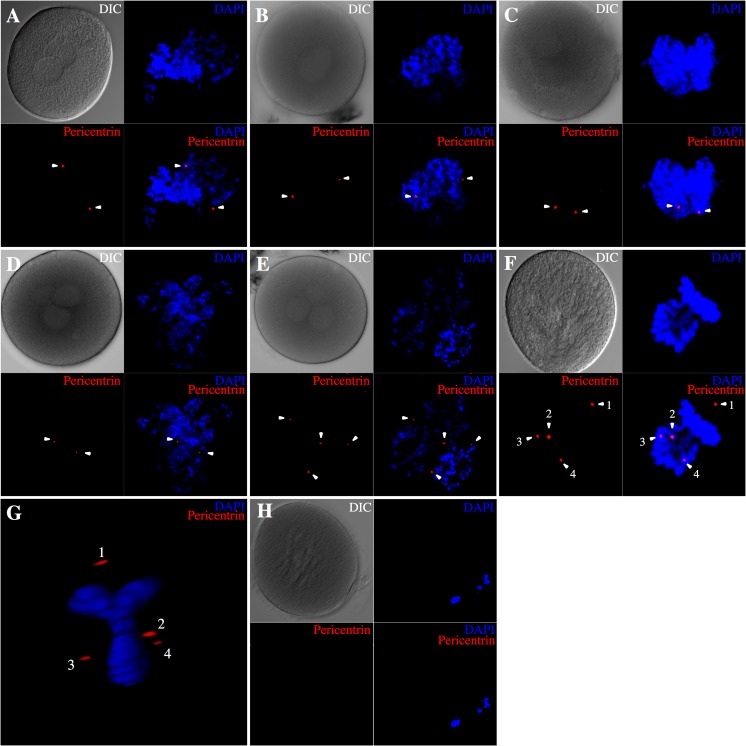
Fig. 2.
Centrosome number in normal and abnormal zygotes. Confocal Z-series projection images of immunofluorescent staining for pericentrin (red) are shown. The pericentrin signal is indicated with an arrowhead, and DNA was counterstained with DAPI (blue). The panels labeled DIC show the differential interference contrast images. a Two pericentrin signals were detected around two PNs in normal zygotes. b, d Both 1PN (b) and 3PN (d) zygotes derived from ICSI show two pericentrin signals. c Some 1PN zygotes derived from c-IVF showed two pericentrin signals. e Many 3PN zygotes derived from c-IVF had four centrosomes. f, g Y-shaped metaphase plate and four centrosomes are apparent in 3PN zygotes derived from c-IVF at syngamy. h No pericentrin signal was detected in an unfertilized MII oocyte

