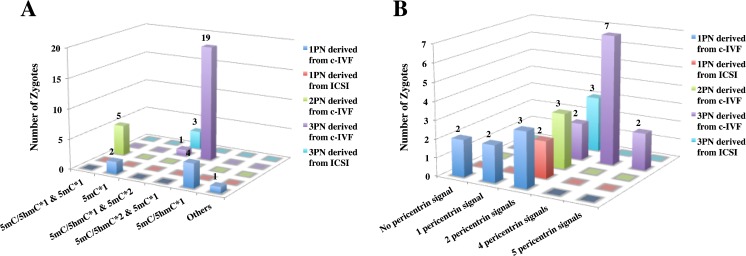
Fig. 3.
Summary of 5mC/5hmC and pericentrin analysis. 3D bar charts of the numbers of zygotes, which are classified according to PN numbers and ART procedure for each analysis, are shown. a The result disaggregated by 5mC and 5hmC status. b The result disaggregated by the number of pericentrin signals (equal to centrosome numbers)

