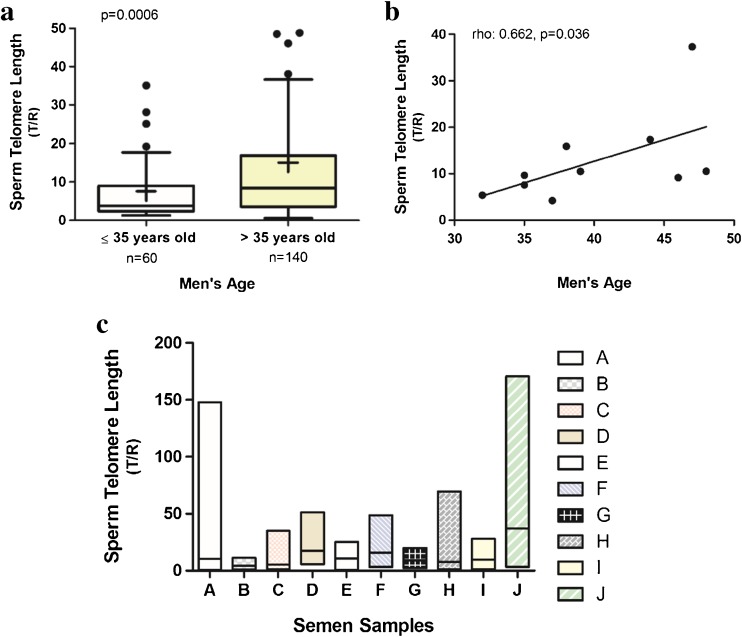
Fig. 1.
Sperm telomere length (STL) increases as men age and varies markedly within the same sample. a Older men’s STL was significantly longer than younger men’s. The box plot displays the first and third quartiles; the median is represented by the line that bisects the boxes and the mean is represented by +. The horizontal lines outside the box display minimum and maximum values. The outliers are represented by the black dots, but there were 5 outliers from the older men group (values: 170.5; 147.9; 115.2; 110.0; 51.2) and 2 outliers from the younger men group (values: 69.4; 63.4) not represented in the graph in order to highlight the behavior of the other values. b Correlation between STL and men’s age. The Spearman correlation coefficient (rho) and p value are shown. c STL of individual spermatozoa varied markedly within the same sample. The column bar’s borders display minimum and maximum values and the line that bisects the bars displays the mean

