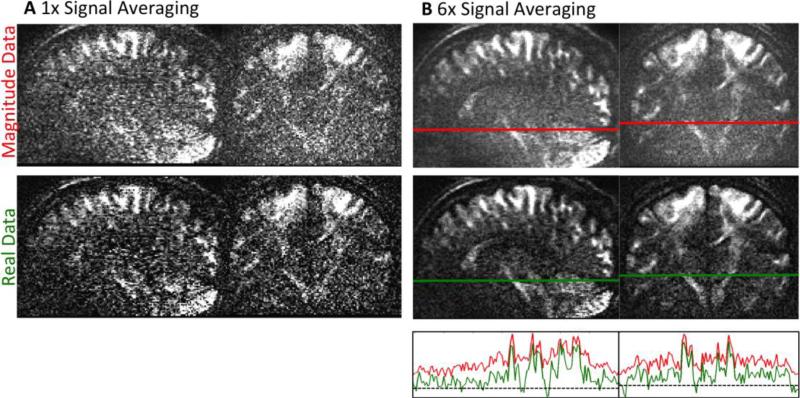
Figure 3.
A Single repletion of dMRI data with low SNR for magnitude (top) and phase corrected real-valued data (bottom). B Results of signal averaging for both data types. After six averages, the magnitude data show accumulated noise - visible as a “mist” overlaying the image. The phase corrected real-valued dMRI data are not affected by noise bias. Therefore, averaging visibly increases SNR for real diffusion data. The bottom graph of Figure B shows the signal course of real and magnitude data alongside the lines in the averaged data. The dashed line marks a signal intensity of zero. The diminished noise floor of real-valued data allows identifying smaller intensity differences. All images in this figure are displayed on the same scale.

