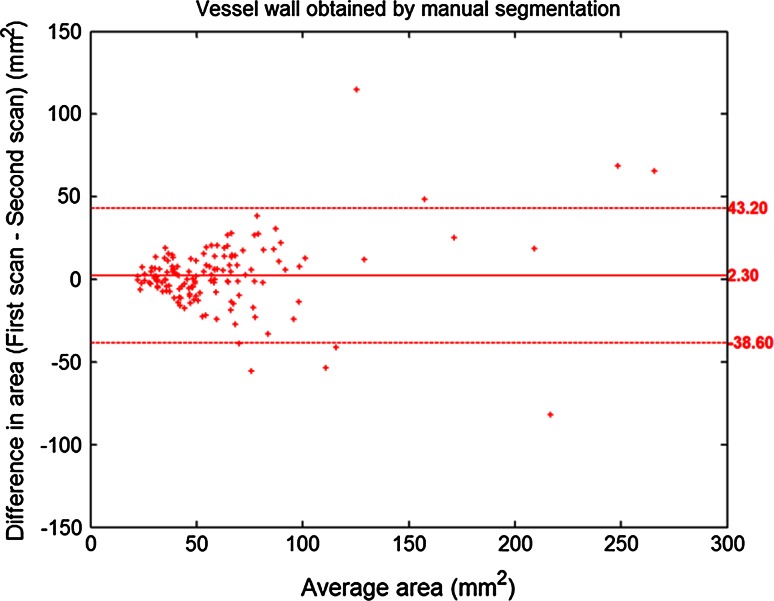
Fig. 4.
Bland–Altman plot for inter-scan vessel wall area assessment based on manually traced contours. The middle horizontal line indicates the bias and the upper and lower horizontal lines indicate the 95 % limits of agreement. The bias is not significantly different from 0 (p = 0.08), indicating the absence of significant bias between the quantified inter-scan vessel wall areas

