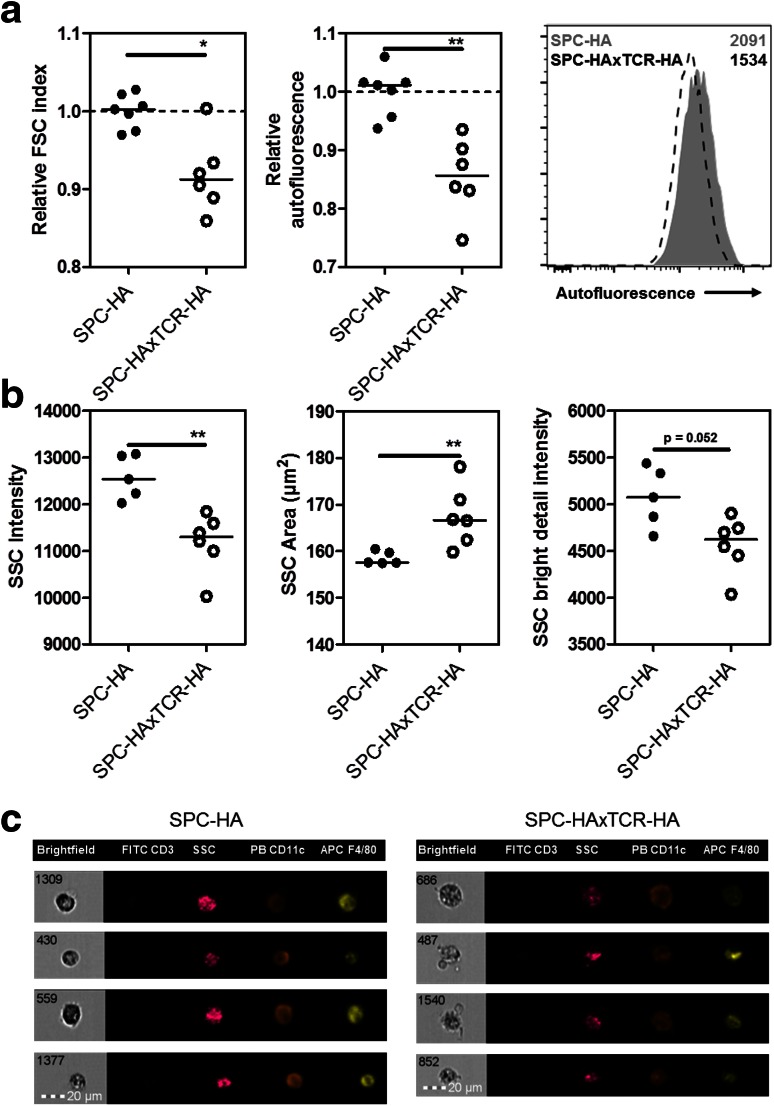
Fig. 1.
Flow cytometric analyses of AM morphology in healthy and diseased lungs. a BAL cells from SPC-HA (n = 6) and SPC-HAxTCR-HA (n = 6) mice were analyzed by FACS; AMs were identified as FSChighSSChighF4-80+autofluorescencehigh cells. Relative FSC and autofluorescence were calculated by median fluorescence intensity (MFI) of individual sample/mean MFI of the SPC-HA (healthy) control group. Representative histogram depicts autofluorescent signal intensities of AMs from SPC-HA (gray shaded) versus SPC-HAxTCR-HA (dashed line) mice and their respective MFI (see numbers). b BAL cells from SPC-HA (n = 5) and SPC-HAxTCR-HA (n = 6) mice were analyzed by imaging flow cytometry (analyzed SSC-parameters: intensity, area, bright detail intensity); AMs were identified as F4-80+CD11c+CD3− cells. Statistical analyses were performed by using unpaired, two-tailed Mann–Whitney-test. *p < 0.05, **p < 0.01 c Representative images from imaging flow cytometer FlowSight® of alveolar macrophages from SPC-HA and SPC-HAxTCR-HA mice, PB pacific blue

