
Table 2.
Change in Pre- to Post-Training Cognitive Scores
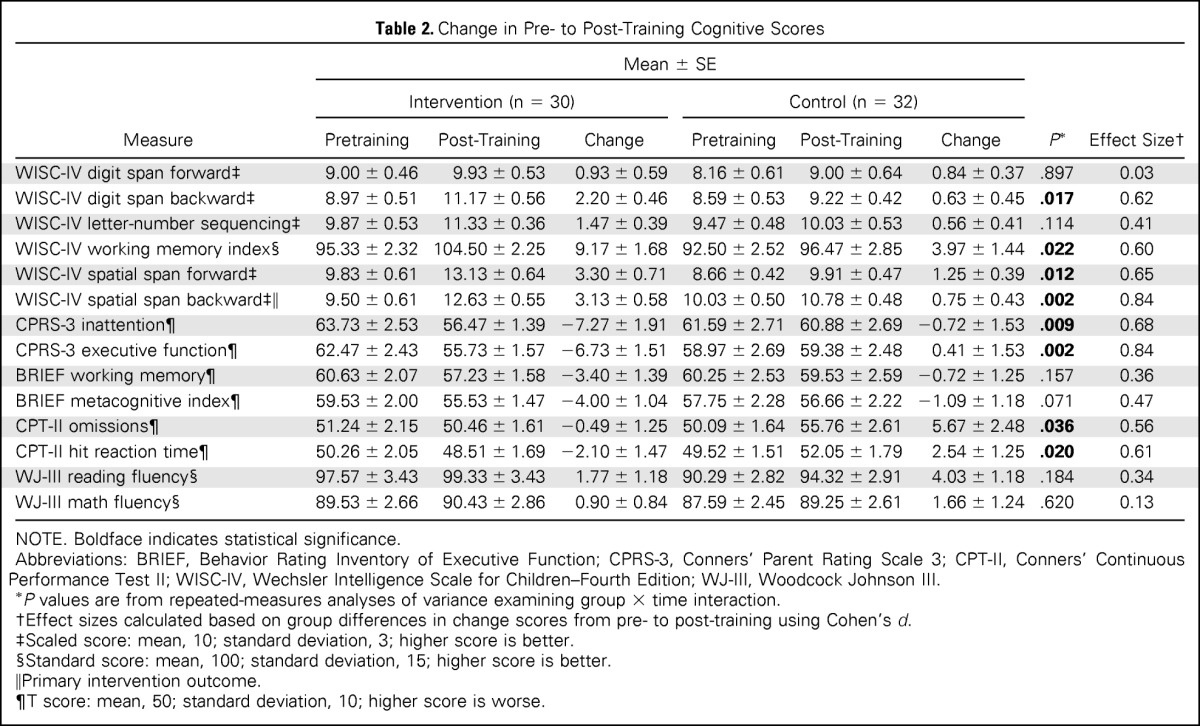
| Measure | Mean ± SE |
P* | Effect Size† | |||||
|---|---|---|---|---|---|---|---|---|
| Intervention (n = 30) |
Control (n = 32) |
|||||||
| Pretraining | Post-Training | Change | Pretraining | Post-Training | Change | |||
| WISC-IV digit span forward‡ | 9.00 ± 0.46 | 9.93 ± 0.53 | 0.93 ± 0.59 | 8.16 ± 0.61 | 9.00 ± 0.64 | 0.84 ± 0.37 | .897 | 0.03 |
| WISC-IV digit span backward‡ | 8.97 ± 0.51 | 11.17 ± 0.56 | 2.20 ± 0.46 | 8.59 ± 0.53 | 9.22 ± 0.42 | 0.63 ± 0.45 | .017 | 0.62 |
| WISC-IV letter-number sequencing‡ | 9.87 ± 0.53 | 11.33 ± 0.36 | 1.47 ± 0.39 | 9.47 ± 0.48 | 10.03 ± 0.53 | 0.56 ± 0.41 | .114 | 0.41 |
| WISC-IV working memory index§ | 95.33 ± 2.32 | 104.50 ± 2.25 | 9.17 ± 1.68 | 92.50 ± 2.52 | 96.47 ± 2.85 | 3.97 ± 1.44 | .022 | 0.60 |
| WISC-IV spatial span forward‡ | 9.83 ± 0.61 | 13.13 ± 0.64 | 3.30 ± 0.71 | 8.66 ± 0.42 | 9.91 ± 0.47 | 1.25 ± 0.39 | .012 | 0.65 |
| WISC-IV spatial span backward‡‖ | 9.50 ± 0.61 | 12.63 ± 0.55 | 3.13 ± 0.58 | 10.03 ± 0.50 | 10.78 ± 0.48 | 0.75 ± 0.43 | .002 | 0.84 |
| CPRS-3 inattention¶ | 63.73 ± 2.53 | 56.47 ± 1.39 | −7.27 ± 1.91 | 61.59 ± 2.71 | 60.88 ± 2.69 | −0.72 ± 1.53 | .009 | 0.68 |
| CPRS-3 executive function¶ | 62.47 ± 2.43 | 55.73 ± 1.57 | −6.73 ± 1.51 | 58.97 ± 2.69 | 59.38 ± 2.48 | 0.41 ± 1.53 | .002 | 0.84 |
| BRIEF working memory¶ | 60.63 ± 2.07 | 57.23 ± 1.58 | −3.40 ± 1.39 | 60.25 ± 2.53 | 59.53 ± 2.59 | −0.72 ± 1.25 | .157 | 0.36 |
| BRIEF metacognitive index¶ | 59.53 ± 2.00 | 55.53 ± 1.47 | −4.00 ± 1.04 | 57.75 ± 2.28 | 56.66 ± 2.22 | −1.09 ± 1.18 | .071 | 0.47 |
| CPT-II omissions¶ | 51.24 ± 2.15 | 50.46 ± 1.61 | −0.49 ± 1.25 | 50.09 ± 1.64 | 55.76 ± 2.61 | 5.67 ± 2.48 | .036 | 0.56 |
| CPT-II hit reaction time¶ | 50.26 ± 2.05 | 48.51 ± 1.69 | −2.10 ± 1.47 | 49.52 ± 1.51 | 52.05 ± 1.79 | 2.54 ± 1.25 | .020 | 0.61 |
| WJ-III reading fluency§ | 97.57 ± 3.43 | 99.33 ± 3.43 | 1.77 ± 1.18 | 90.29 ± 2.82 | 94.32 ± 2.91 | 4.03 ± 1.18 | .184 | 0.34 |
| WJ-III math fluency§ | 89.53 ± 2.66 | 90.43 ± 2.86 | 0.90 ± 0.84 | 87.59 ± 2.45 | 89.25 ± 2.61 | 1.66 ± 1.24 | .620 | 0.13 |
NOTE. Boldface indicates statistical significance.
Abbreviations: BRIEF, Behavior Rating Inventory of Executive Function; CPRS-3, Conners' Parent Rating Scale 3; CPT-II, Conners' Continuous Performance Test II; WISC-IV, Wechsler Intelligence Scale for Children–Fourth Edition; WJ-III, Woodcock Johnson III.
P values are from repeated-measures analyses of variance examining group × time interaction.
Effect sizes calculated based on group differences in change scores from pre- to post-training using Cohen's d.
Scaled score: mean, 10; standard deviation, 3; higher score is better.
Standard score: mean, 100; standard deviation, 15; higher score is better.
Primary intervention outcome.
T score: mean, 50; standard deviation, 10; higher score is worse.