FIGURE 1.

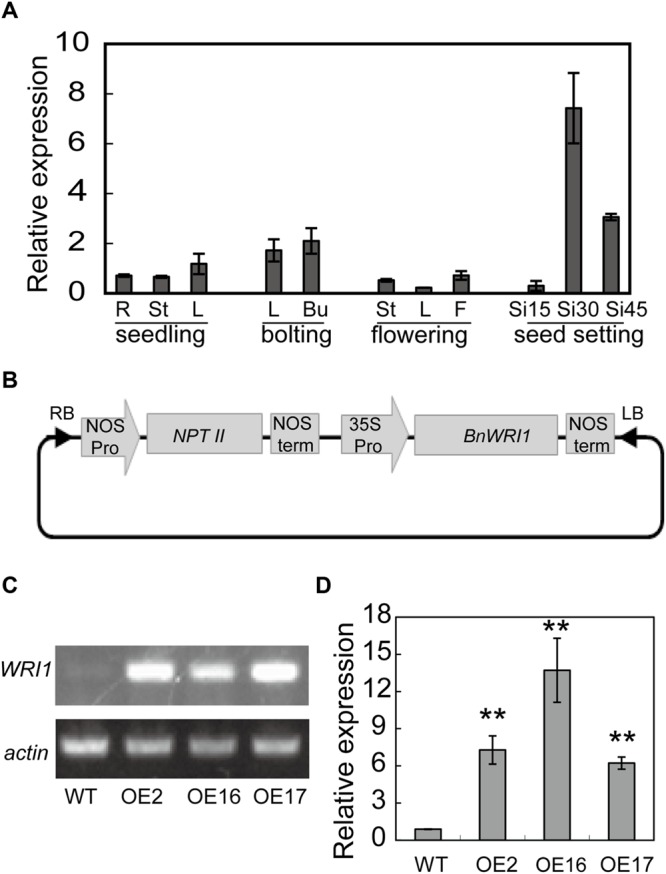
BnWRI1 expression pattern and overexpression (OE) of BnWRI1 in Brassica napus. (A) Transcript level of BnWRI1 in different B. napus tissues at seedling, bolting, flowering and seed developing stages. The expression level was quantified by real-time PCR normalized to the expression of BnActin. Values are mean ± SD (n = 3). R, root; St, stem; L, leaf; Bu, flower bud; F, flower; and Si15, Si30, and Si45, siliques at 15, 30, and 45 days, respectively, after anthesis. (B) The construct containing BnWRI1 in the binary vector pBI121. (C,D) The transcript level of BnWRI1 in BnWRI1-OE plants according to semi-quantitative RT-PCR (C) and quantitative real-time PCR (D). Total RNA was extracted from the leaves of 6-week-old plants, and the expression level was detected by using BnWRI1-specific primers. The expression levels were normalized to BnActin. OE2, OE16, and OE16 represent BnWRI1-OE lines. Values are mean ± SD (n = 3). ∗∗Indicates significant difference at P < 0.01 compared with the WT based on Student’s t-test.
