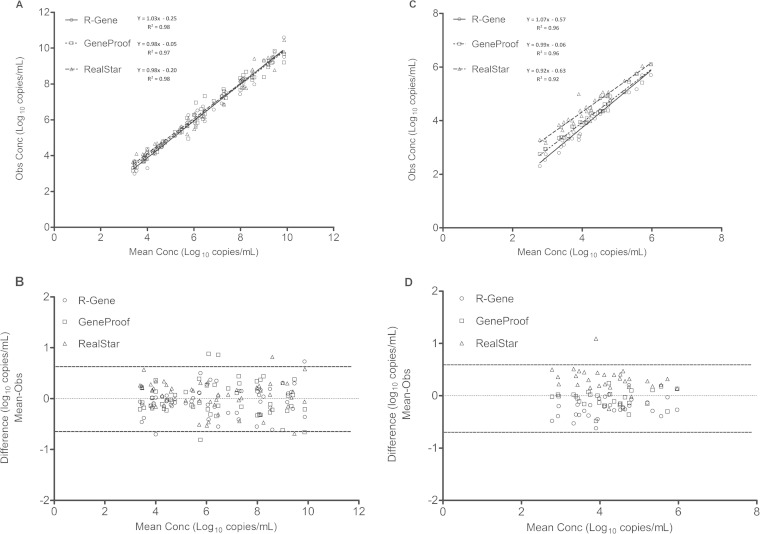
FIG 1.
Comparison of positive BKV loads in urine samples (A and B) and plasma samples (C and D) by the R-gene, RealStar, and GeneProof assay techniques. (A and C) Correlations between BKV loads obtained with the three assays. (B and D) Bland-Altman analysis of the mean viral load (log10 copies per milliliter) compared to the observed values for each assay. The solid lines represent the mean differences, and the dashed lines represent the means ± 1.96 SD.

