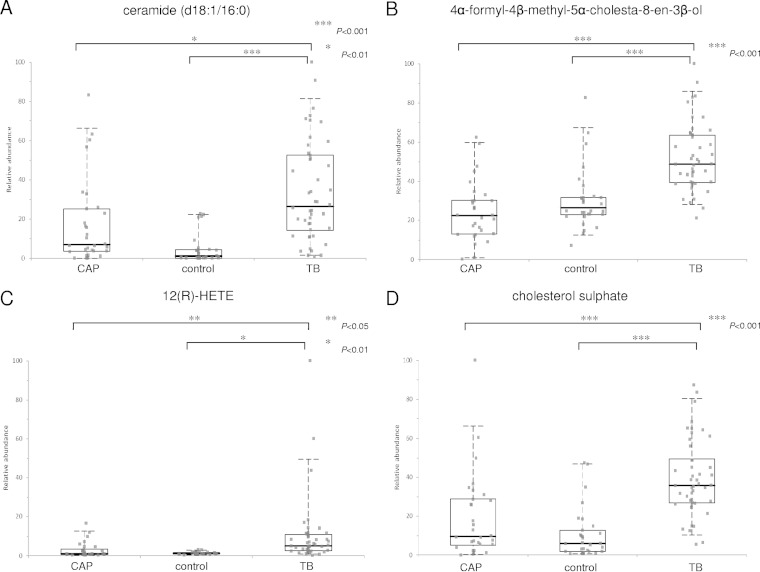
FIG 4.
Box-and-whisker plots representing relative abundance of ceramide (d18:1/16:0) (A), 4α-formyl-4β-methyl-5α-cholesta-8-en-3β-ol (B), 12(R)-HETE (C), and cholesterol sulfate (D) in the plasma from TB patients, CAP patients, and controls without active infections. The relative abundance of each metabolite in the plasma from TB patients was significantly higher than that of the other two groups using Student's t test. The horizontal line represents the median, the bottom and the top of the box represent the 25th and the 75th percentiles, and the whiskers represent the 5th and 95th percentiles.

