
Fig. 4.
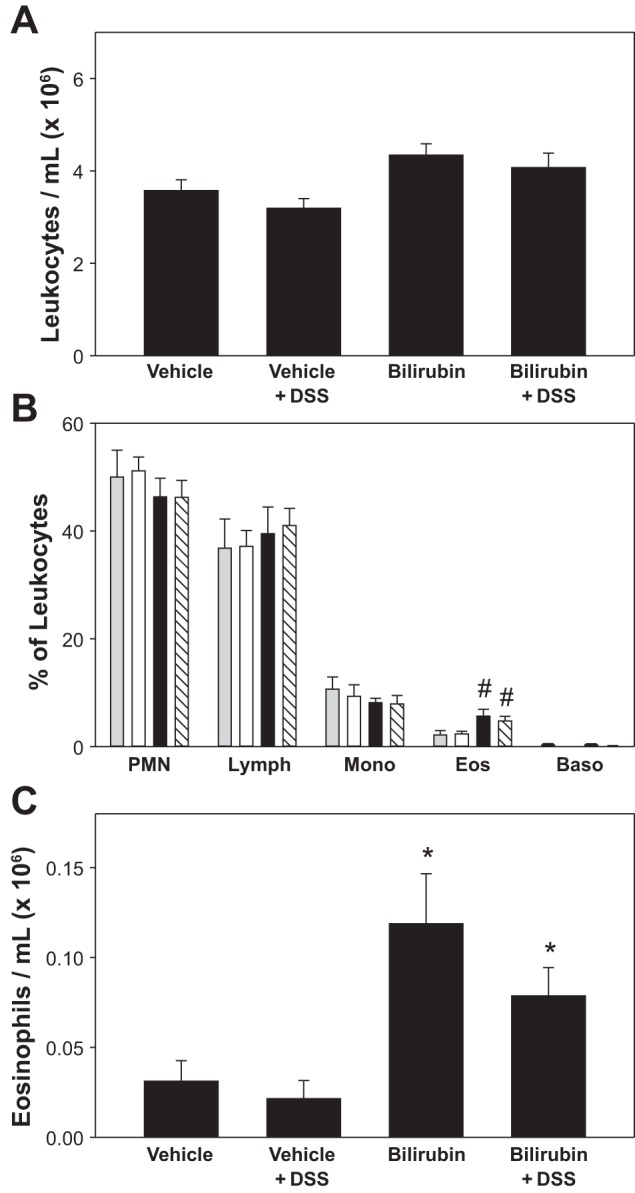
Effect of bilirubin on peripheral blood leukocytes. A: average total leukocyte count (±SE). B: mean percentage of neutrophils (PMN), lymphocytes (Lymph), monocytes (Mono), eosinophils (Eos), and basophils (Baso) in the peripheral blood of mice treated with vehicle alone (shaded bars), DSS plus vehicle (open bars), bilirubin alone (solid bars), or DSS plus bilirubin (hatched bars). C: peripheral blood eosinophil counts determined by Discombe's staining, plotted as the average number of eosinophils/ml (× 106). #P < 0.05 vs. vehicle and vehicle plus DSS; *P < 0.01 vs. vehicle and vehicle plus DSS.