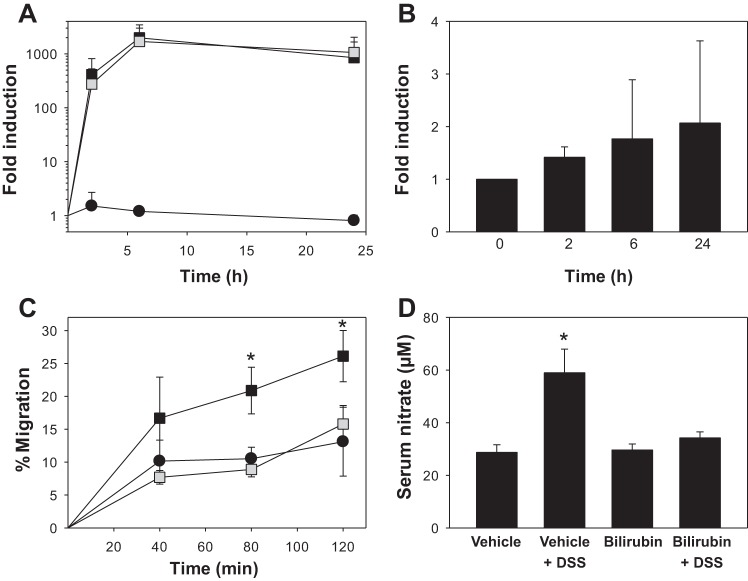
Fig. 5.
Influence of bilirubin on cellular IL-5 production, leukocyte transendothelial migration, and serum nitrate concentration. A: effect of 10 μM bilirubin (shaded symbols) on the time course for the expression of IL-5 mRNA in HSB-2 cells, as determined by quantitative PCR. Cells were incubated in the presence (squares) or absence (circles) of 4 ng/ml PMA and 1 μM ionomycin with data reflecting IL-5 expression (±SE) relative to that in untreated cells at time 0 (n = 4). B: HSB-2 cells were incubated with 10 μM bilirubin for the indicated time intervals and IL-5 mRNA levels are plotted relative to expression at time 0. C: time course for Jurkat cell migration across human umbilical vein endothelial cells (HUVEC) monolayers preincubated for 16 h in the presence (squares) or absence (circles) of TNF-α (5 ng/ml). CellTrace Far Red-labeled Jurkat cells were overlaid onto the monolayers in the presence of 20 μM bilirubin (shaded symbols) or vehicle (solid symbols). Displayed is the percentage of overlaid cells that migrated to the lower chamber, as quantified by measuring fluorescence intensity (ex: 625 nm, em: 670 nm). D: mean serum nitrate concentration for each treatment group. *P < 0.05 vs. all other groups.

