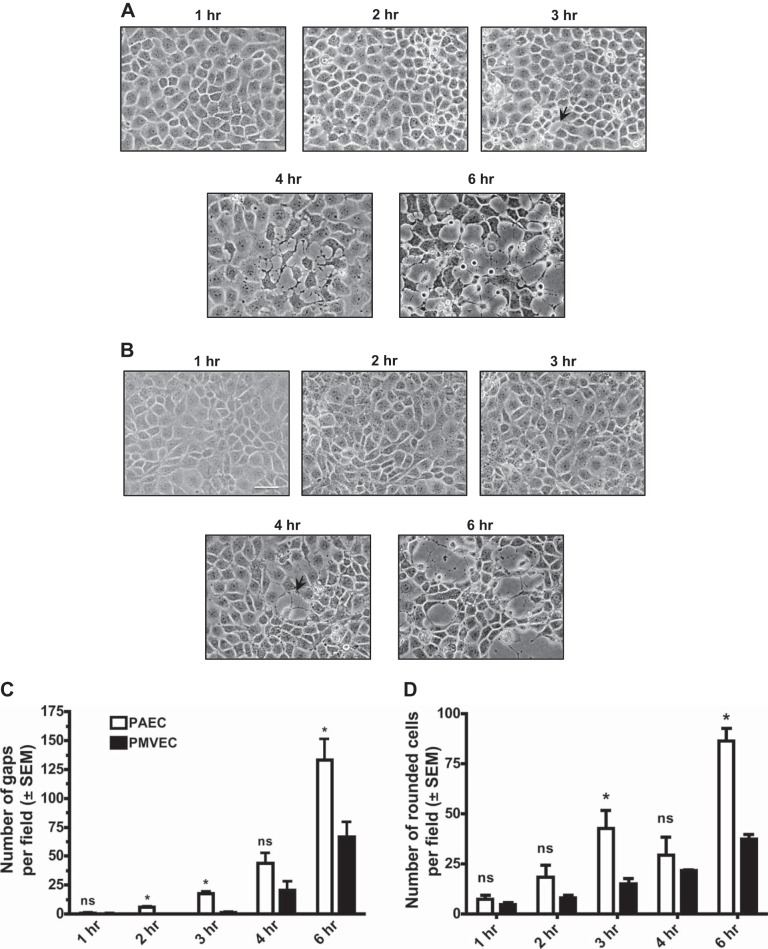
Fig. 2.
PAECs are more sensitive to ExoY+ infection than PMVECs. PAECs and PMVECS were inoculated with the ExoY+ bacterial strain in HBSS for 6 h at a multiplicity of infection (MOI) of 20:1. A: beginning 1 h after inoculation with ExoY+, small cracks between PAECs progressed to large intercellular gap formation in a time-dependent manner. B: beginning 3 h after inoculation with ExoY+, small cracks between PMVECs progressed to large intercellular gap formation in a time-dependent manner. C: beginning 2 h after inoculation with ExoY+, there is a significant difference (indicated by *) in gap number between PAECs and PMVECs. Images in A and B are each representative of at least 3 separate experiments. Images in A and B were captured at ×20 magnification with the scale bar equal to 10 μm. Arrows indicate interendothelial cell gaps. In C, gaps were manually quantified using ImageJ software as an average no. of gaps across multiple fields of view chosen at random. Values are averages from 3 independent experiments with error bars representing SE. In D, rounded cells were manually quantified using ImageJ software as an average number of rounded cells across multiple fields of view chosen at random. Values are averages from 3 independent experiments with error bars representing SE. Student's t-test was used to determine statistical significance at each time point when comparing PAECs with PMVECs. *P < 0.05. ns, No statistical significance between groups analyzed.

