
Figure 4. Changes in proportion of Treg after clodronate ablation of macrophages.
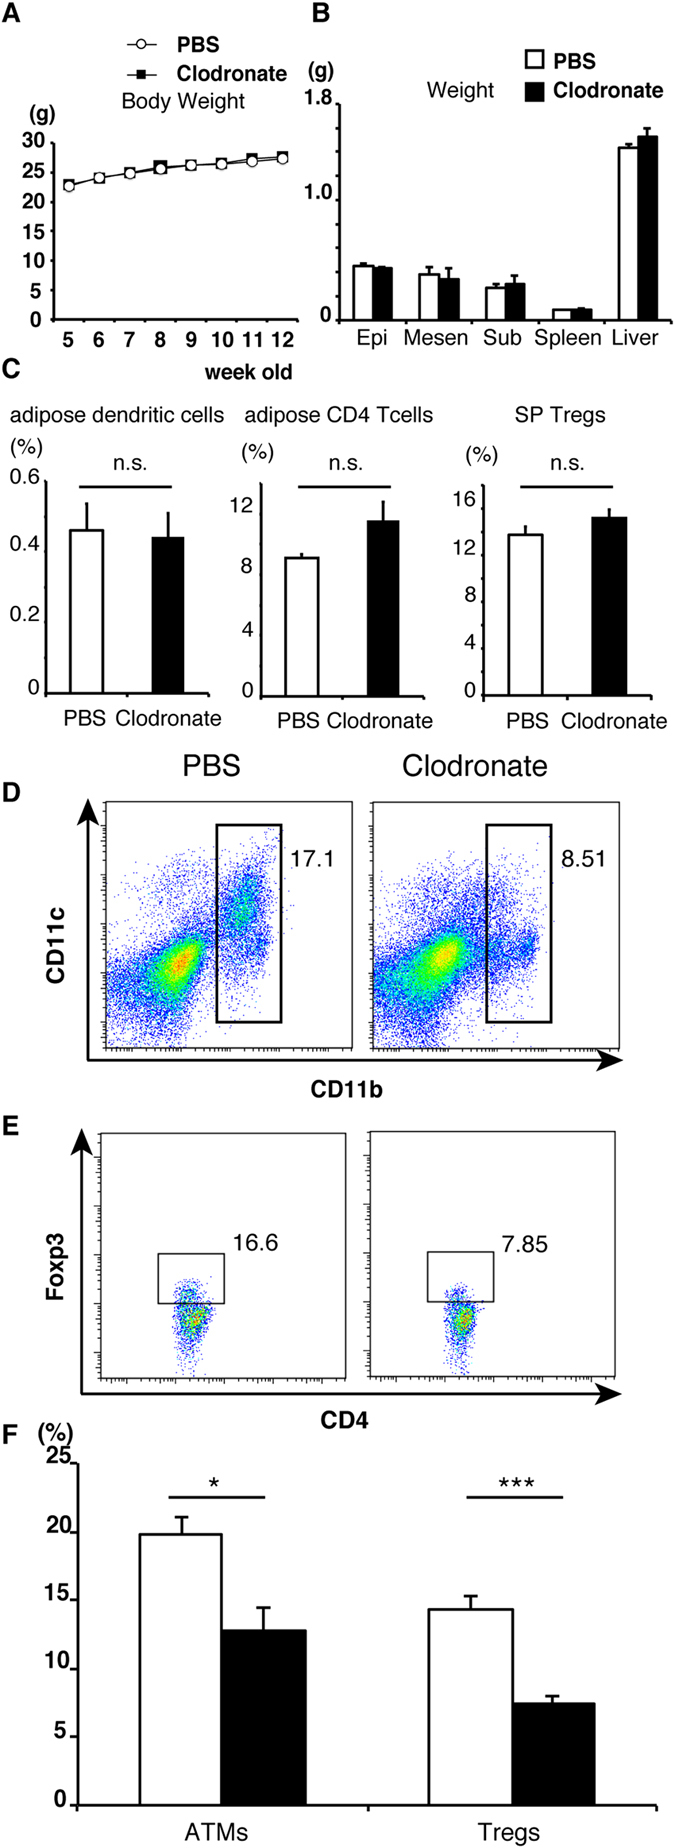
(A) Serial changes in body weight in each group (n = 3 for clodronate treated group and n = 9 for PBS treated group). (B) Summary of organ weight (epididymal fat, mesenteric fat, subcutaneous fat, spleen and liver) in each group. Data are mean ± SEM of three independent experiments (A,B). The proportions of adipose dendritic cells ((C); left), adipose CD4 T cells ((C)); middle), splenic Tregs ((C); right), ATMs (D) and adipose Tregs (E) obtained from NC-fed mice were analyzed by FACS. Right: clodronate-treated group, left: PBS-treated group. (F) The proportion of ATMs and adipose Tregs in each group calculated from results in (D,E). Data are mean ± SEM of three independent experiments. For (F): *P < 0.05, ***P < 0.001.