
FIG. 3.
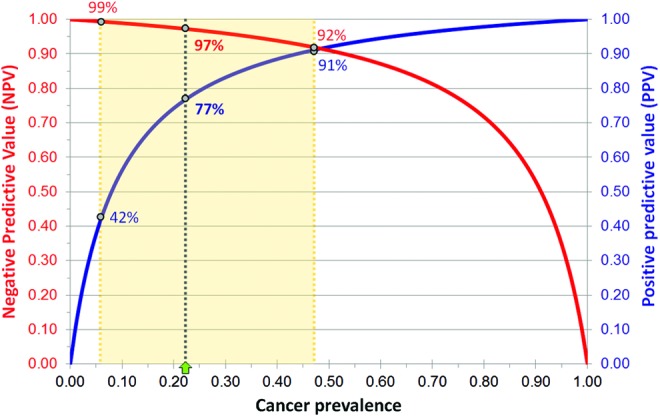
Negative predictive value (NPV; red line) and positive predictive value (PPV; blue line) of ThyroSeq v2.1 in thyroid nodules with atypia of undetermined significance/follicular lesion of undermined significance cytology found in this cohort with a cancer prevalence of 22.5% (black dotted line) and expected in a range of cancer prevalence rates between 6% and 48% (yellow dotted lines). Color images available online at www.liebertpub.com/thy