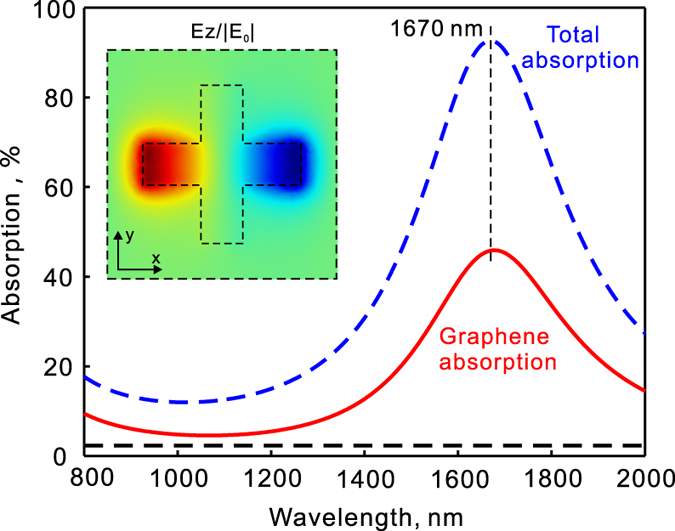
Figure 2. Absorption enhancement in graphene by plasmonic light trapping.

(a) Simulated spectra of total absorption (blue dashed line) as well as absorption in the graphene (red solid line) for the structure in Fig. 1a. The inset shows the field distributions at the resonance as denoted by the vertical dashed lines. The light is incident at normal direction with its electric field polarized along the x-direction. The field is plotted at the x–y plane that is 25 nm below the bottom surface of the gold crosses. The flat dashed line shows the absorption in a free standing graphene without enhancement.
