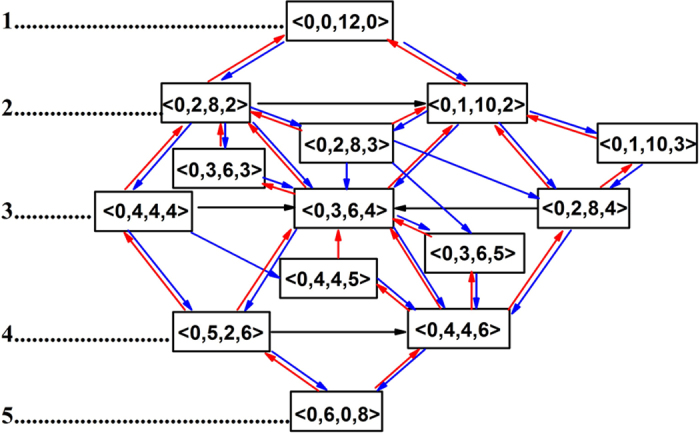
Figure 5. Crystallization pathways from an icosahedral SRO to a bcc one.

The blue arrow stands for the crystallization process while the red arrow corresponds to the melting process. The numbers in the left is the group ID. The black arrow represents the transformations within the same group.
