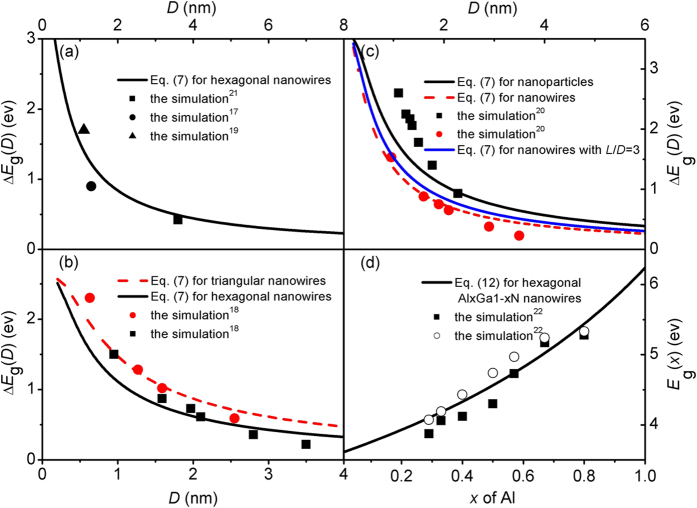
Figure 2. ΔEg(D) functions of GaN nanoparticles and nanowires and Eg(x) functions of AlxGa1-xN nanowires with D = 15 nm where the curves denote the model predictions of Eqs. (7) and (12) while the symbols are the computer simulation results and the experimental data17,18,19,20,21,22.
For AlN, Eg(∞) = 6.03 eV and h = a2/(6c)+c/4 ≈ 0.159 nm with a = 0.311 nm and c = 0.508 nm54.

