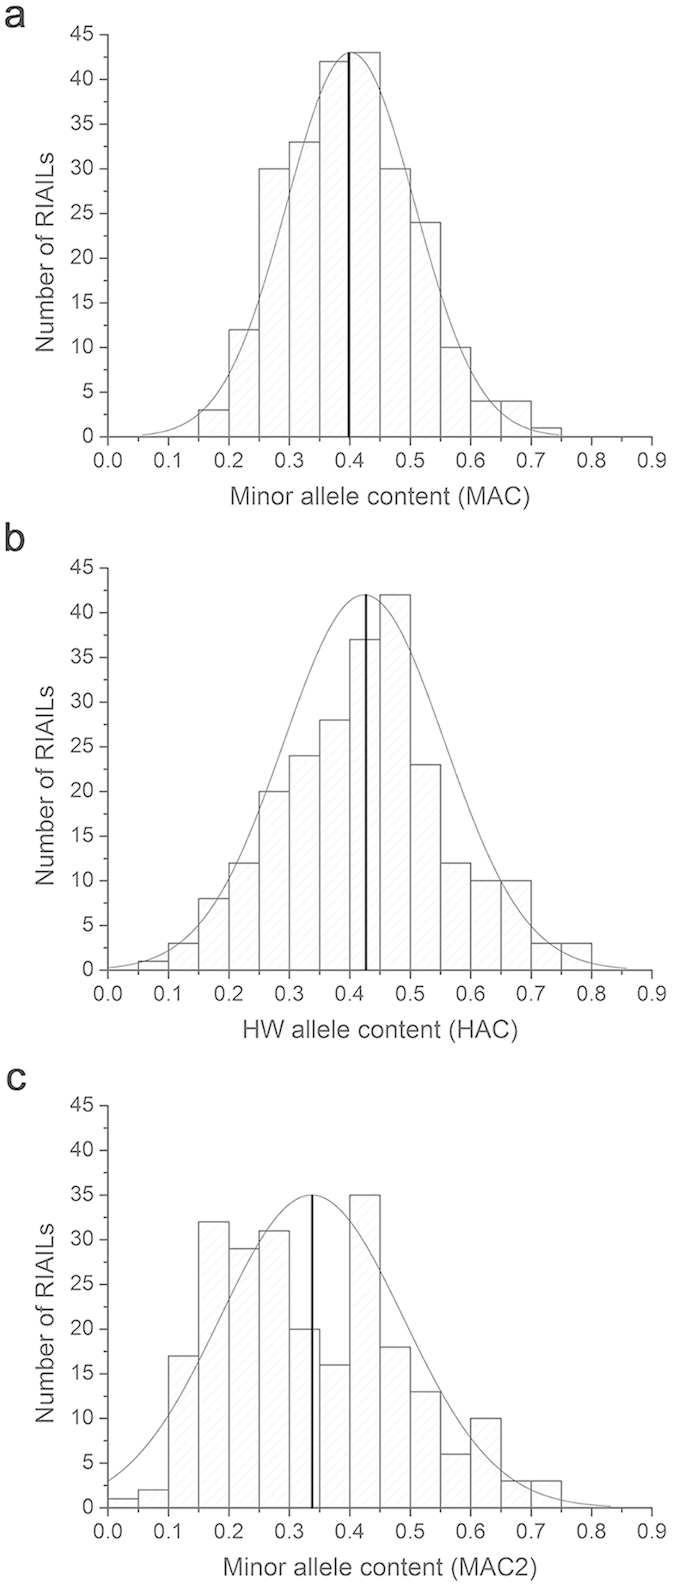
Figure 1. Distribution profiles of MAC and HAC in a panel of 237 RIAILs.

(a) Minor allele content (MAC) calculated using 1454 SNPs. (b) HW allele content (HAC) calculated using 1454 SNPs. (c) MAC2 calculated using 526 SNPs with MAF significantly smaller than 0.5. The bold vertical line indicates the position of the mean value.
