
Figure 2.
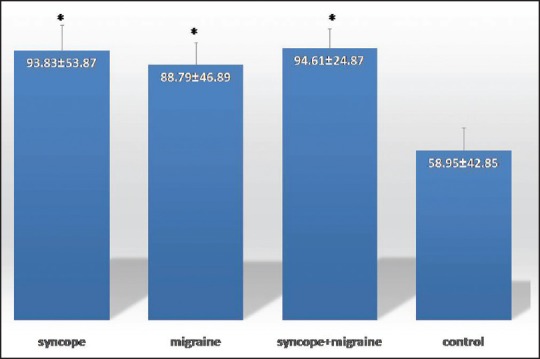
Serum intercellular adhesion molecule ng/ml in syncope, migraine, syncope and migraine, and control groups. Standard error of the mean is shown as the error bar. Data are shown as means ± standard deviation. *P < 0.05 versus control
Official websites use .gov
A
.gov website belongs to an official
government organization in the United States.
Secure .gov websites use HTTPS
A lock (
) or https:// means you've safely
connected to the .gov website. Share sensitive
information only on official, secure websites.
Serum intercellular adhesion molecule ng/ml in syncope, migraine, syncope and migraine, and control groups. Standard error of the mean is shown as the error bar. Data are shown as means ± standard deviation. *P < 0.05 versus control