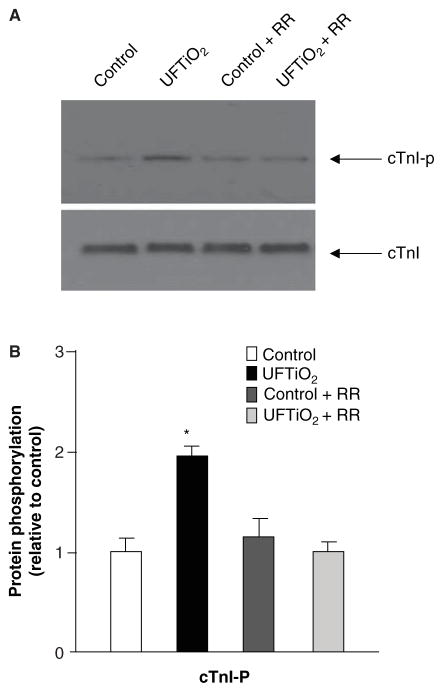
Figure 5.
The Western blot represents cardiac TnI phosphorylation and expression in different groups at 24 h post-exposure. (A) Each lane of the Western blot shows cardiac TnI phosphorylation and expression in a myocyte preparation from an individual rat. (B) Densitometry values of specific bands were compared between each treatment and the control group. Each value represents the mean ± SD of three different experiments; p < 0.05 compared with the control group (*).

