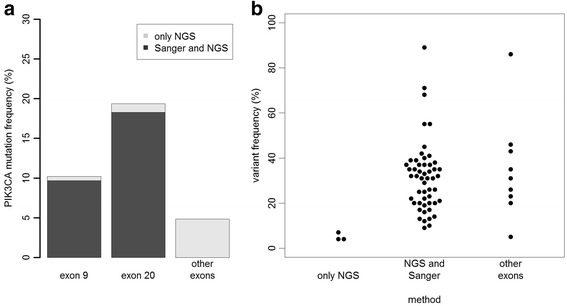
Fig. 2.

Detection sensitivity of semiconductor NGS compared to Sanger sequencing. a Barplot showing the number of mutations detected by both Sanger sequencing and NGS and the mutations detected only by NGS. b Beeswarm plot showing the variant frequencies of the mutations detected only by NGS and those detected by both methods
