Fig. 1.

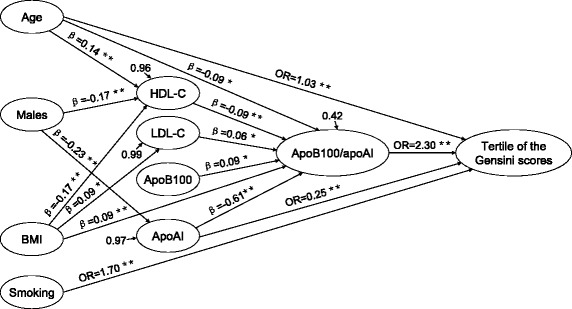
Significant regression paths among dependent (the tertile of the Gensini scores) and independent variables. * P ≤ 0.05, ** P ≤ 0.01, standardized regression coefficients (β) or odds ratios (OR) represented as one-way arrows

Significant regression paths among dependent (the tertile of the Gensini scores) and independent variables. * P ≤ 0.05, ** P ≤ 0.01, standardized regression coefficients (β) or odds ratios (OR) represented as one-way arrows