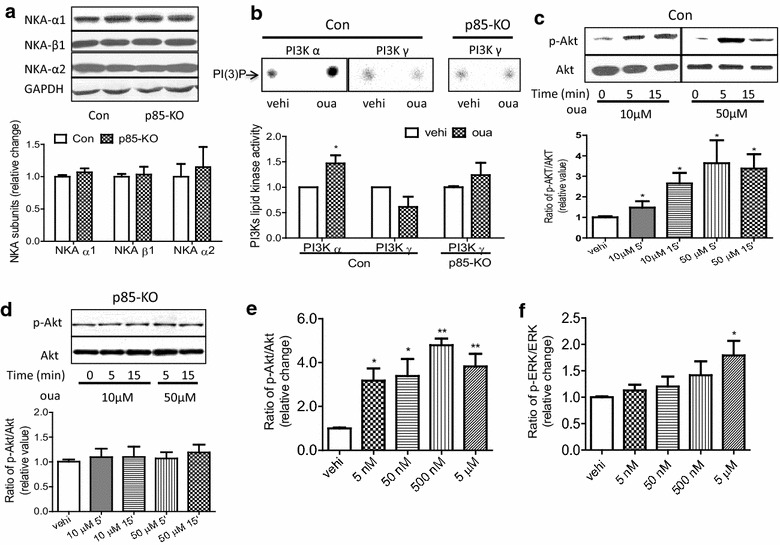
Fig. 2.

Comparison of ouabain-induced signaling in cultured cardiomyocytes from Con and p85-KO mice. a. Representative blots of Na+/K+-ATPase isoforms (top). GAPDH was used as a loading control. Quantitative data of expression of Na+/K+-ATPase isoforms (n = 6) (bottom); b. representative PI(3)P dots show the effect of ouabain (50 μM, 5 min) on PI3Kα and PI3Kγ lipid kinase activities in Con and p85-KO cardiomyocytes, vehicle (vehi) (top). Quantitative data of PI3K activity from the top. (n = 9, *P < 0.05 vs. vehi); c representative blots of the effect of ouabain on Akt activation in Con cardiomyocytes (top). Quantitative data of Akt activation from the top (n = 6, *P < 0.05 vs. vehi); d representative blots of the effect of ouabain on Akt activation in p85-KO cardiomyocytes (top). Quantitative data of Akt activation from the top. (n = 6, *P < 0.05 vs. vehi). e ouabain (5 min) dose- responses on Akt activation in wild-type cardiomyocytes (n = 6, *P < 0.05, **P < 0.01 vs. vehi) and f ouabain (5 min) dose- responses on ERK activation in wild-type cardiomyocytes (n = 6, *P < 0.05 vs. vehi)
