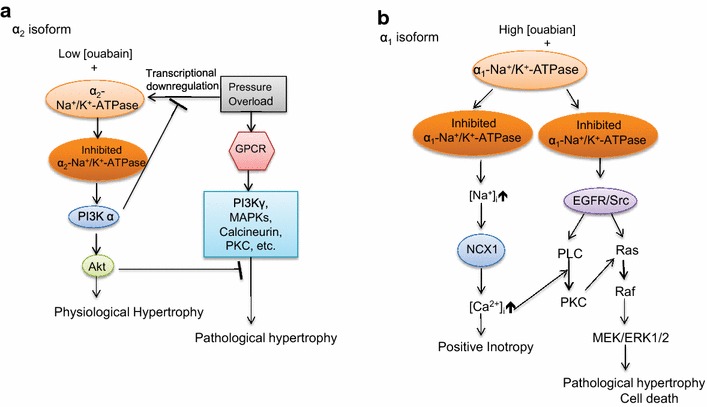
Fig. 9.

Schematic presentation of ouabain’s different growth-related effects on α1 and α2 isoforms of Na+/K+-ATPase in the mouse cardiomyocytes. a α2-isoform: activation by sub-inotropic ouabain concentrations (< 40 nM) of the signaling cascades that lead to physiological hypertrophy, and block TAC-induced pathological hypertrophy and b α1-isoform: induction of positive inotropy by higher concentrations of ouabain, and activation of signaling cascades that leads to pathological hypertrophy and cell death. See “Discussion”
