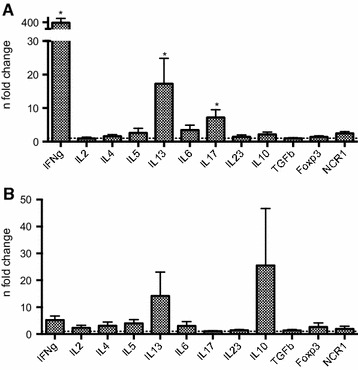
Figure 4.

qRT-PCR results of circulating PBMC from uninfested Belgian Blue and Holstein–Friesian cattle. A Gene transcription profile in PBMC of uninfested BB (n = 8). B Gene transcription profile in PBMC of uninfested HF (n = 4). qRT-PCR results of PBMC re-stimulated with 5 μg/mL P. ovis antigen are presented as mean fold changes in re-stimulated compared to unstimulated cells (dashed horizontal line) (*P < 0.05)
