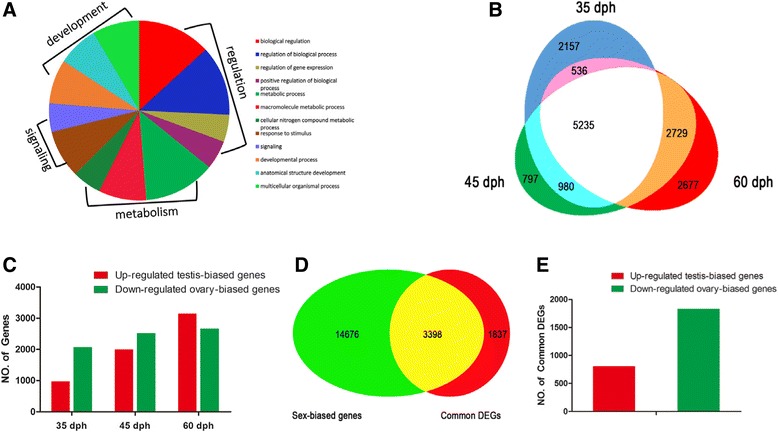
Fig. 3.

Expression changes of sex-biased genes during gonad differentiation. a Pie charts representing the main GO terms (biological process) associated with the DEGs in germ cell-depleted gonads. Only GO terms with >800 DEG sequences are shown (Except for DEGs in germ cell-depleted gonads at 25 dph). b Venn diagram shows the commonly and differentially DEGs existed in the germ cell-depleted gonads at 35 dph, 45 dpg and 60 dph. c Sex-biased gene expression patterns in germ cell-depleted gonads in comparison to WT gonads from 35 dph to 60 dph. d Venn diagram shows the overlap association between common DEGs in germ cell-depleted gonads from 35 dph to 60 dph and sex-biased genes in normal testis and ovary. e Expression pattern of sex-biased genes in common DEGs in germ cell-depleted gonads from 35 dph to 60 dph
