
Fig. 5.
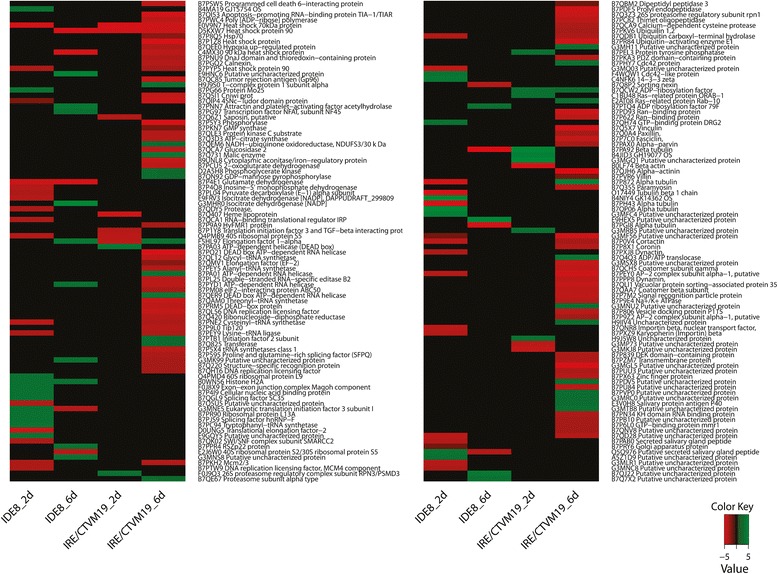
Representation profiles of differentially-represented proteins in TBEV-infected IDE8 and IRE/CTVM19 cells. Differentially-represented proteins in IDE8 and IRE/CTVM19 and their levels of differential representation on days 2 (2d) and 6 (6d) p.i. are depicted in the heatmap. Green = over-represented; red = under-represented; black = no change. Numbers on the colour key indicate the log2-fold change in differential representation