
Fig. 5.
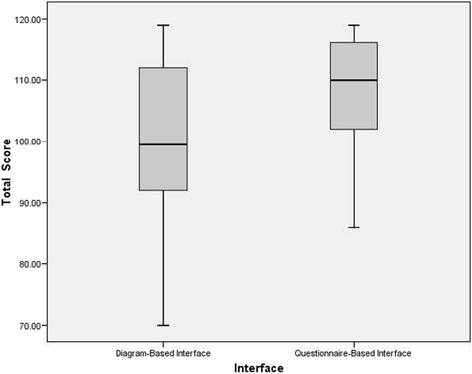
Box plot of the average satisfaction score of both interface modes. The satisfaction score for the questionnaire-based interface was significantly higher than the score for the diagram-based interface (p = 0.001)
Official websites use .gov
A
.gov website belongs to an official
government organization in the United States.
Secure .gov websites use HTTPS
A lock (
) or https:// means you've safely
connected to the .gov website. Share sensitive
information only on official, secure websites.
Box plot of the average satisfaction score of both interface modes. The satisfaction score for the questionnaire-based interface was significantly higher than the score for the diagram-based interface (p = 0.001)