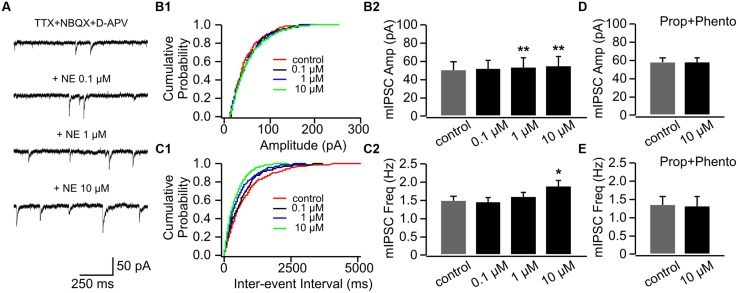
FIGURE 7.
The effects of NE on mIPSCs in P14+. (A) Example mIPSC traces of a cell with various concentrations of NE. (B1) Cumulative probability of mIPSC amplitudes in one cell. (B2) Amplitudes (Amp) of mIPSCs at various NE concentrations. (C1) Cumulative probability of mIPSC inter-event intervals in one cell. (C2) Frequencies (Freq) of mIPSCs at various NE concentrations. (D) Amplitudes of mIPSC at various NE concentrations in the presence of propranolol (Prop) and phentolamine (Phento). (E) Frequencies of mIPSCs at various NE concentrations in the presence of propranolol and phentolamine. ∗p < 0.05; ∗∗p < 0.01.

