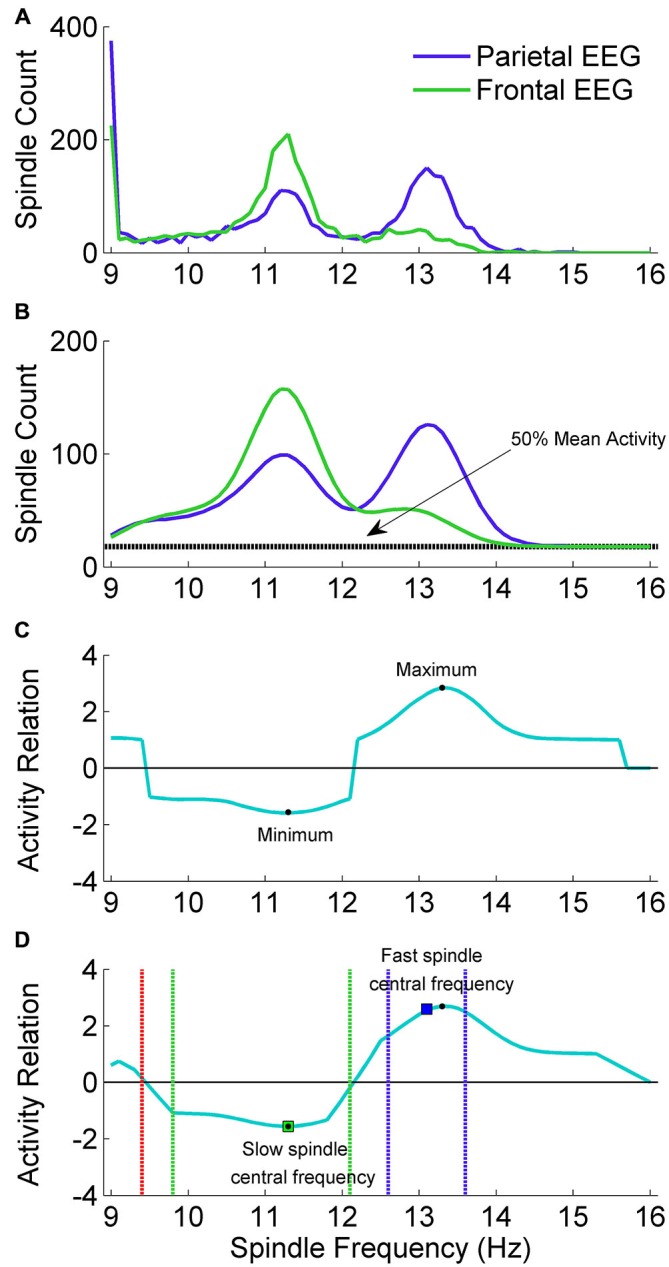
Figure 3.

The adjustment scheme of individual spindle frequency range. (A) The outcome of spindle activity scan which resulted in two vectors of spindle activity over frequency range separately for frontal channel F3A2 (vecslow: green color) and parietal channel P3A2 (vecfast: blue color). (B) In both activity vectors the value in 9 Hz was set to zero, vectors were smoothed and 50% of mean spindle activity (dashed black line) was added to both of them. (C) Vector (vecrel) showing a relation of spindle activity between frontal EEG and parietal EEG, computed according to “Spindle Activity Comparison” Section. (D) Smoothed vecrel. First, algorithm localized minimum and maximum (black dots). Localized minimum in vecrel was set as slow spindle central frequency (green square). Localized maximum in vecrel was a starting point to estimate fast spindle frequency ranges using vecfast. Local maximum in vecfast was set as fast spindle central frequency (blue square). Ranges of fast (dashed blue lines) and slow (dashed green lines) spindle frequency were estimated according to “Spindle Activity Comparison” Section. First frequency bin below slow spindle range in which spindle activity was higher in the parietal channel was set as frequency in which slow spindles are unlikely (stopdetect: red dashed line).
