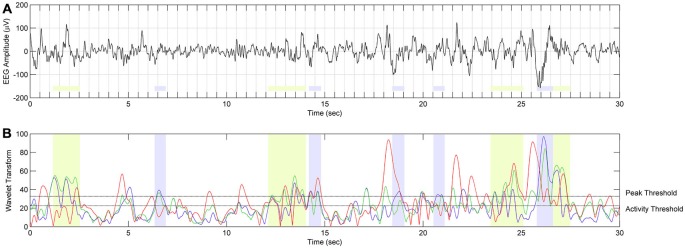
Figure 5.
The scheme of spindle detection. (A) EEG signal from C3A2 derivation during SWS in twin 10a during night 2 (localization of spindle frequency ranges and overall results of spindle detection in twin 10a are presented in Figure 4). (B) The result of continuous wavelet transform (CWT) in time and frequency domain. Red color depicts WT result using wavelet corresponding to 9 Hz frequency. Events with this frequency are not classified as spindles. Green color depicts WT using wavelets corresponding to 10.4–12 Hz frequency range. Events detected in this frequency range are classified as slow spindles (light green color). Blue color depicts WT using wavelets corresponding to 12.5–13.5 Hz frequency range. Events detected in this frequency range are classified as fast spindles (light blue color).

