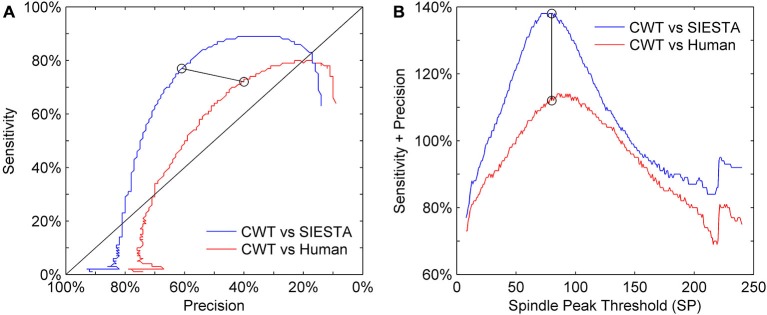
Figure 6.
Sensitivity-precision plot showing how these two measures depend on spindle detection thresholds. Sleep spindles were scored in C3A2 EEG channel. (A) ROC-like plot of sensitivity vs. precision, (B) the sum of sensitivity and precision according to detection thresholds variety. We had two detection thresholds in our algorithm: spindle peak threshold (SP) set as 80 times basic threshold (BT) and spindle activity threshold (SA) set as 55 times BT (calculation of BT is described in “Threshold Setup” Section). We illustrate how performance changes according to SP, where y axis shows multiplication rate of BT used to obtain SP, but for each iteration values of both thresholds were changed together to always keep the same ratio between them (SP = 1.45 × SA). Black circles connected with black line mark sensitivity and precision obtained for thresholds chosen for our algorithm.

