
Figure 8.
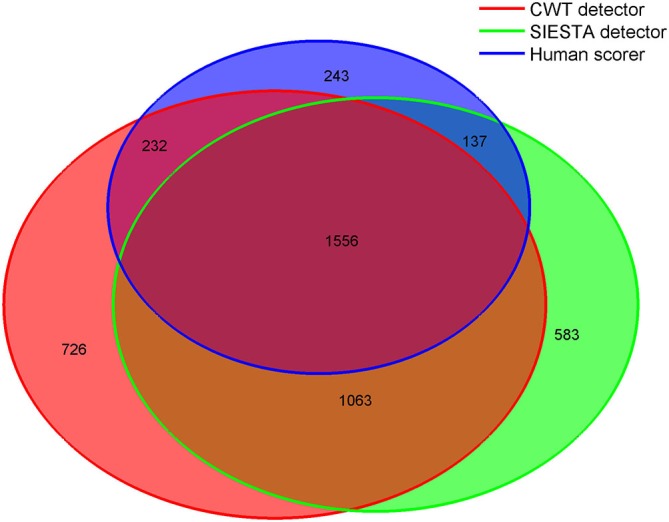
Venn diagram showing in numbers of detected spindles, how spindles detected by each scorer overlapped with spindles detected by other scorers. Sleep spindles were detected during stage 2 in C3A2 EEG derivation.
Official websites use .gov
A
.gov website belongs to an official
government organization in the United States.
Secure .gov websites use HTTPS
A lock (
) or https:// means you've safely
connected to the .gov website. Share sensitive
information only on official, secure websites.
Venn diagram showing in numbers of detected spindles, how spindles detected by each scorer overlapped with spindles detected by other scorers. Sleep spindles were detected during stage 2 in C3A2 EEG derivation.