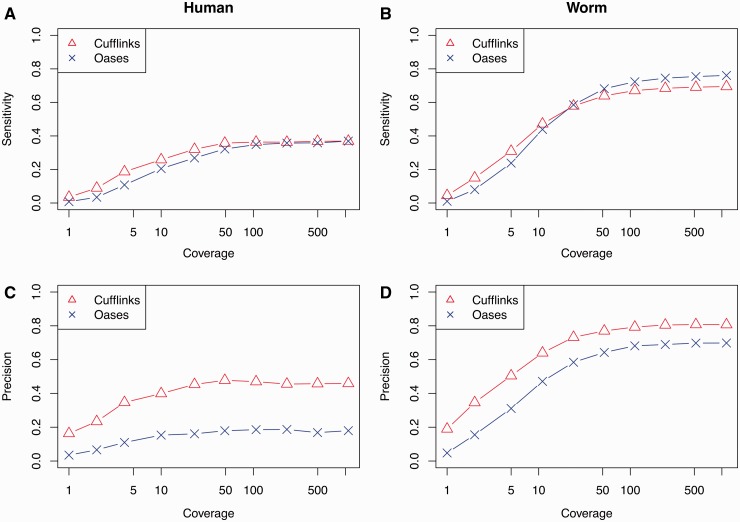
Figure 4.
Transcriptome reconstruction accuracy for varying coverage values. Sensitivity (top panels, labelled A and B) and precision (bottom panels, labelled C and D) of transcripts reconstructed using Cufflinks (triangles) and Oases (crosses) as a function of simulated read coverage for human (left panels, labelled A and C) and worm (right panels, labelled B and D) transcriptomes. A colour version of this figure is available at BIB online: http://bib.oxfordjournals.org.

