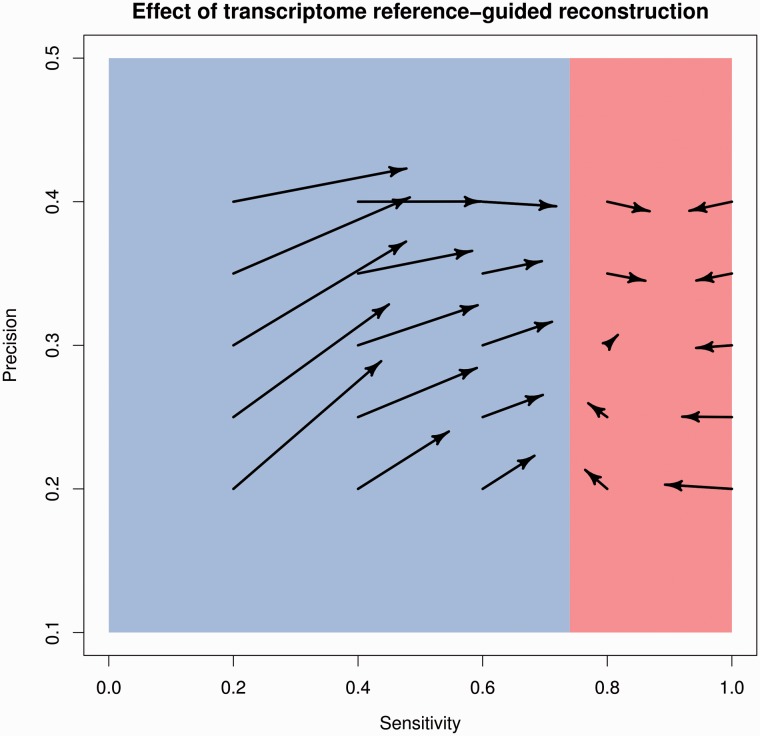
Figure 8.
Sensitivity and precision of starting and final transcript sets obtained by RABT. Arrows start at the sensitivity and precision values of the simulated annotations and point to the final sensitivity and precision of the RABT output. Sensitivity decreases are sometimes observed when the starting sensitivity is >0.8. Values shown are the mean over three independent simulations.

