Fig. 3.
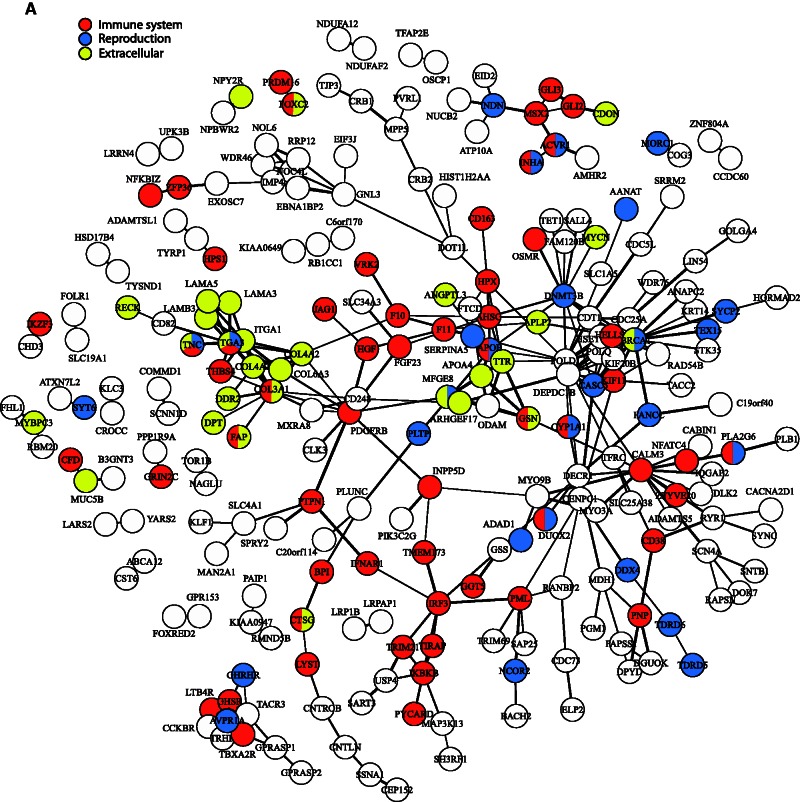
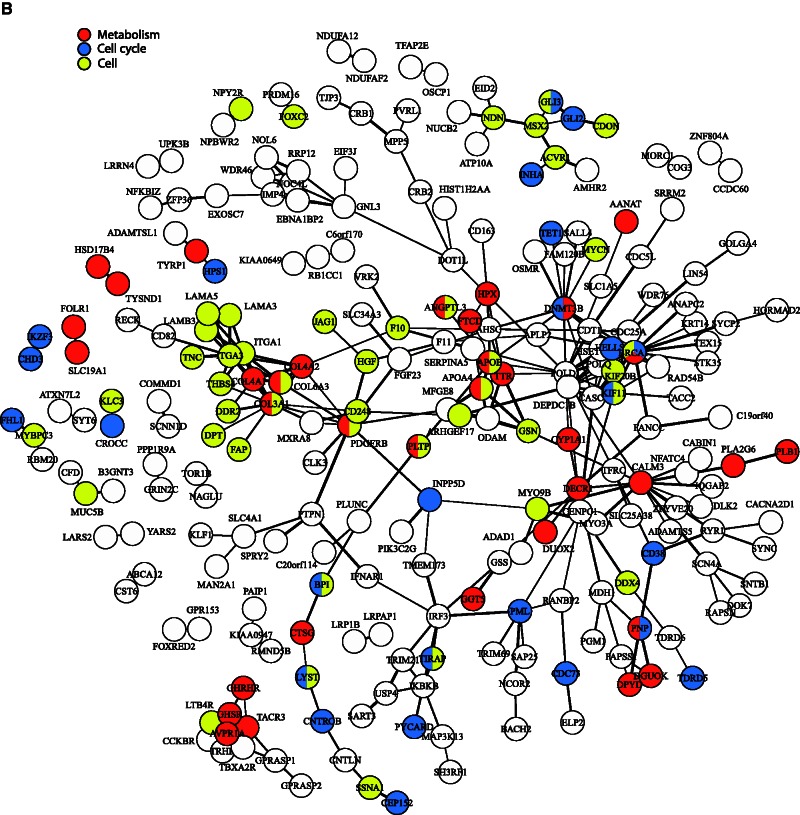
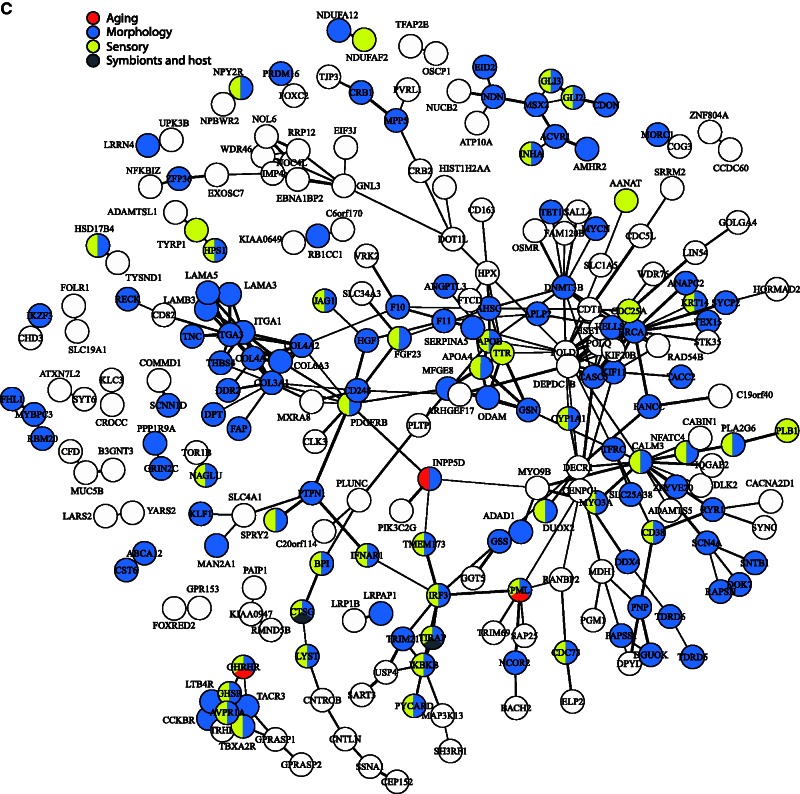
Protein–protein interactions visualized as a network. Connection thickness corresponds to the confidence of the interaction, with a thicker line indicating stronger evidence. Evidence is based on combined interaction scores of the following lines of evidence: neighborhood, fusion, co-occurrence, homology, coexpression, experimental knowledge, and text mining. (A) Genes have been classified into three broad categories with nodes colored as follows: red, “immune system” (e.g., “response to virus,” “regulation of natural killer cell activation”); blue, “reproduction” (e.g., “fertilization,” “sexual reproduction”); and yellow, “extracellular” (e.g., “extracellular matrix disassembly,” “biological adhesion”). (B) Genes have been classified into three broad categories with nodes colored as follows: red, “metabolism” (e.g., “hormone metabolic process,” “fat-soluble vitamin metabolic process”); blue, “cell cycle” (e.g., “DNA methylation,” “centriole replication”); and yellow, “cell” (e.g., “cell motility,” “localization of cell”). (C) Genes have been classified into four broad categories with nodes colored as follows: red, “aging” (e.g., “determination of adult lifespan,” “multicellular organismal aging”); blue, “morphology” (e.g., “biomineral tissue development,” “anatomical structure regression”); yellow, “sensory” (e.g., “phototransduction,” “inner ear receptor cell development”); and gray, “symbionts and host” (e.g., “growth involved in symbiotic interaction,” “growth of symbiont in host”).


