Fig. 3.
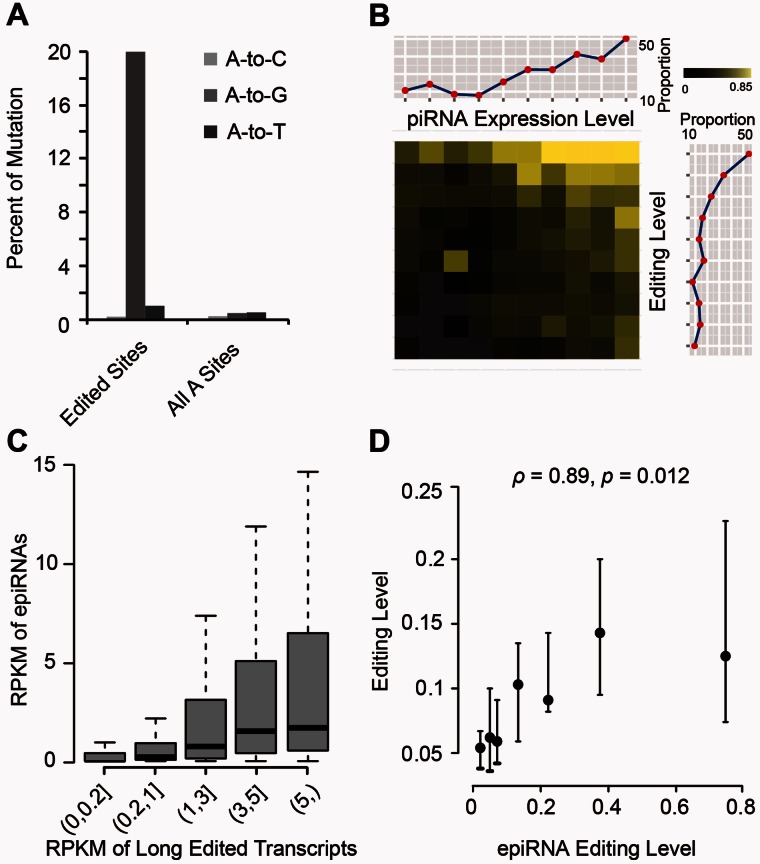
Evidence for the derivation of epiRNAs from edited long transcripts. (A) Using mRNA-associated editing sites as the reference, nucleotide variants were identified for the piRNAs. Prevalence of the indicated mutation types at the editing location (Edited Sites) and at any “A” sites on piRNAs (All A Sites) is shown. (B) The probability of detecting RNA editing sites on piRNAs was assessed in relation to other quantitative sequence features. Macaque piRNAs whose locations overlap with mRNA-associated editing sites were selected and divided into groups on the basis of two attributes—the expression levels of piRNA and the editing levels of corresponding sites identified by poly(A)-positive RNA-Seq; their distributions accordingly are shown in the dot line plots on top and left, respectively. The percentage of piRNAs in each bin that were found to harbor editing sites was calculated and represented in the central heatmap. The degree of detection probability is shown in colors in correspondence to the color scale, with missing data in gray. (C) The expression levels of piRNAs (in RPKM) are depicted in boxplots, as binned by the expression levels of the corresponding long transcripts (also in RPKM). (D) piRNAs were binned according to editing levels as estimated by piRNA reads, and plotted against the median editing levels of the corresponding events identified by poly(A)-positive RNA-Seq, with bars representing the 95% confidence interval estimated by 1,000 bootstrap samplings. For the correlation in editing frequencies between the two data sets, the Spearman’s rank correlation coefficient and P value were calculated.

