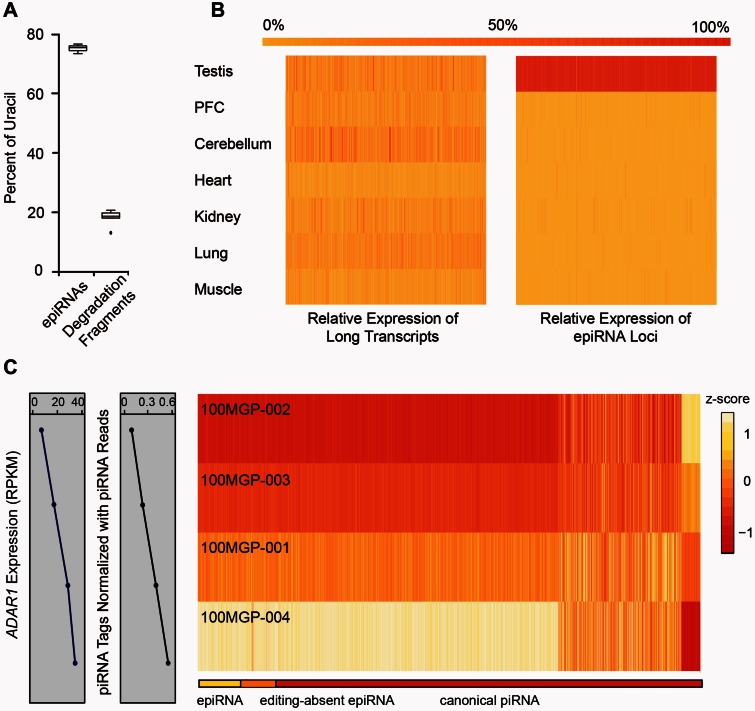
Fig. 5.
Interaction of RNA editing and piRNA biogenesis. (A) The plot shows the percentages of epiRNAs and mRNA degradation fragments with the nucleotide uridine at the 5′-end of the respective sequences. (B) Heatmaps showing the relative expression levels across seven different macaque tissues for long transcripts (left) and small RNAs (right) corresponding to the epiRNA-associated regions, with reference to the color scale on top. (C) The differences in ADAR expression levels and normalized piRNA tag types across four different animals are shown in linear graphs on the left. The heatmap on the right depicts the relative expression levels of piRNAs in each piRNA cluster of the four animals, organized and scaled in rows. These piRNA clusters were categorized into three groups: epiRNAs-expressing clusters (yellow), “editing-absent” epiRNA clusters (overlapping with editing sites on the long transcripts but lack detectable epiRNAs; orange), and canonical piRNA clusters (red), as indicated by the color bar on top.

