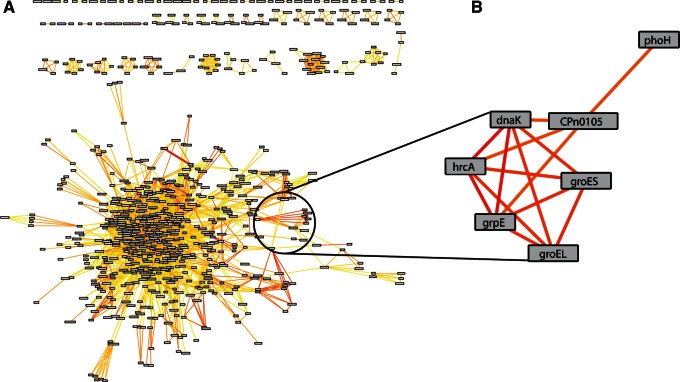
Fig. 5.
Predicted coregulatory network and HrcA regulon for Chlamydia pneumoniae. The predicted coregulatory network (A) for C. pneumonaie CWL029 is shown where nodes in the network represent genes, and edges are predictions of genes to be coregulated based on the similarity of phylogenetic footprints between genes. The color of the edges scale with the strength of a prediction, where dark red represents genes strongly predicted to be coregulated and yellow for weaker predictions. The large interconnected set of genes contains many type III effector proteins and virulence-associated genes. Many of the subnetworks outside of this large “hairball” represent predicted operons. The HrcA regulon (B) is shown as an example of genes that are strongly predicted to be coregulated.

