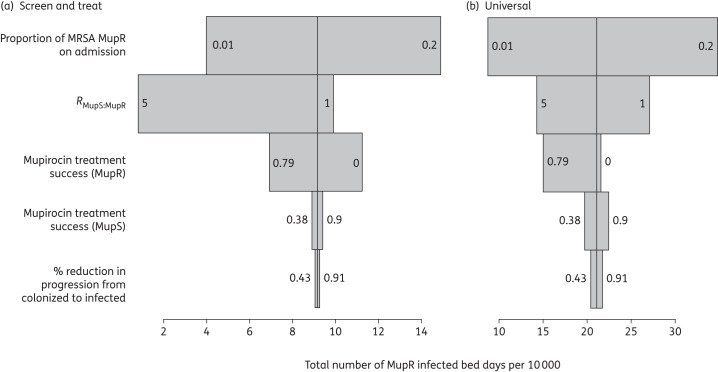
Figure 5.
One-way sensitivity analysis showing the impact of parameter variation on the total number of MupR-infected bed days per 10 000 total bed days after 5 years of policy. Sensitivity analysis: in the plotted sensitivity analyses, only the parameters indicated in the description were varied, holding other parameter values at the base scenario (Tables 2 and 3). The maximum and minimum parameter values, corresponding to the maximum and minimum MupR-infected bed days, are indicated in text on the grey bars. Plots are shown for (a) the ‘screen and treat’ policy and (b) ‘universal’ mupirocin use.

